Unlock a world of possibilities! Login now and discover the exclusive benefits awaiting you.
- Qlik Community
- :
- Forums
- :
- Analytics
- :
- New to Qlik Analytics
- :
- Re: Drill Down | Show next level of hierarchy
- Subscribe to RSS Feed
- Mark Topic as New
- Mark Topic as Read
- Float this Topic for Current User
- Bookmark
- Subscribe
- Mute
- Printer Friendly Page
- Mark as New
- Bookmark
- Subscribe
- Mute
- Subscribe to RSS Feed
- Permalink
- Report Inappropriate Content
Drill Down | Show next level of hierarchy
Hi,
I´ve a given company structure as unbalanced tree:

The speciality is, that I´ve precalculated values for each node. This means there should be NO aggregation (e.g. sum) from the sub-level.
Given this, the requirements in the Qlik Sense app are:
a) It should be possible to drill-down from level to level
b) Only the next sub-level based on the current selection should be displayed
c) Only the values available for the elements of the next sub-level should be summarized, without summing up values from the lower levels
I could achieve this in a QlikView app by the help of the hierarchy in a list box. If I select a single node in this list box, I get the values for the next lower level.
I tried the same in Qlik Sense (with same data model) by the help of a drill-down master element, but failed because the behaviour of drill-down is different than of a hierarchy list box in QlikView.
How can I achieve this in Qlik Sense?
See sample apps in QS and QV!
Thanks for your help in advance,
Thomas
- « Previous Replies
-
- 1
- 2
- Next Replies »
Accepted Solutions
- Mark as New
- Bookmark
- Subscribe
- Mute
- Subscribe to RSS Feed
- Permalink
- Report Inappropriate Content
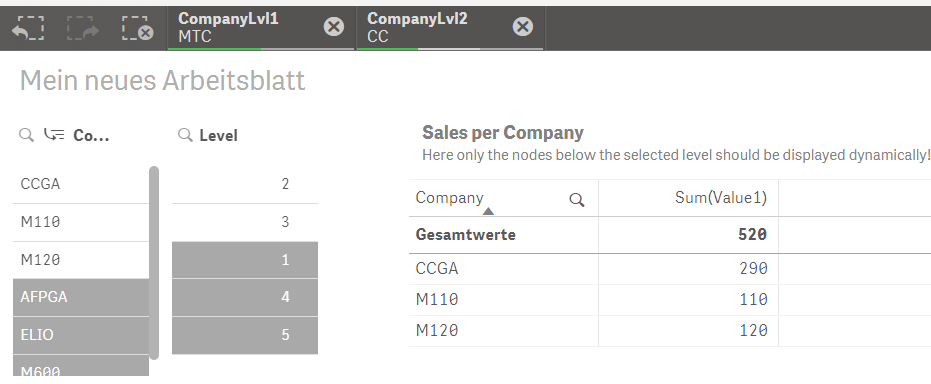
I think I´ve solved it.
I´m displaying the field "Company" in the table. This field is not part of the drill down, but contains all nodes below current selection in the hierarchy.
In the measure I´m using an additional set analysis like:
Sum( {<Level={$(=Min(Level))}>} Value1)
This ensures to show companies of highest level dynamically based on current selection in the drill-down.
- Mark as New
- Bookmark
- Subscribe
- Mute
- Subscribe to RSS Feed
- Permalink
- Report Inappropriate Content
Hi Thomas, the drill-down and summaries are working fine for me. Can you elaborate on what you are finding?
PS if you are able to use extensions, there are some dynamic tree extensions on QlikBranch that you might want to try working with? EG http://branch.qlik.com/#!/project/56728f52d1e497241ae697f0 and http://branch.qlik.com/#!project/578ef4b5171e912050d4133d
- Mark as New
- Bookmark
- Subscribe
- Mute
- Subscribe to RSS Feed
- Permalink
- Report Inappropriate Content
can you share Qlikview snapshot what you are looking for
- Mark as New
- Bookmark
- Subscribe
- Mute
- Subscribe to RSS Feed
- Permalink
- Report Inappropriate Content
What do you mean with QlikView snapshot?
I´ve already attached the (reloadable) QlikView document as well as the Qlik Sense app ...
- Mark as New
- Bookmark
- Subscribe
- Mute
- Subscribe to RSS Feed
- Permalink
- Report Inappropriate Content
yes but i can't open that
sorry for that!
- Mark as New
- Bookmark
- Subscribe
- Mute
- Subscribe to RSS Feed
- Permalink
- Report Inappropriate Content
QVW is for QlikView 12
QVF is for Qlik Sense November Release (to be copied into ..Documents\Qlik\Sense\Apps in case of Qlik Sense Desktop or to be imported via QMC in Qlik Sense Server)
- Mark as New
- Bookmark
- Subscribe
- Mute
- Subscribe to RSS Feed
- Permalink
- Report Inappropriate Content
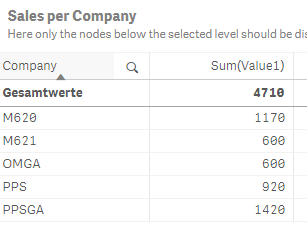
Hi Erica,
if I select a certain node in QlikView like OMIAL ...
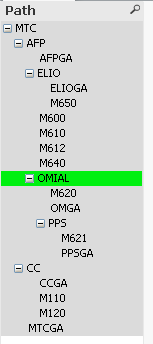
... the table shows me all direct elements of the next level with their values.
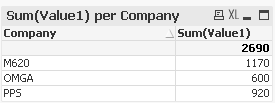
Notice that M621 and PPSGA (from the lowest level) are not shown in the table and are not considered in the calculation. This is because the hierarchy selection in the list box only selects a certain path in the hierarchy table.
I want to have this or similar behaviour also in Qlik Sense, but with the Drill-Down in Qlik Sense I couldn´t achieve this, because it selects always all nodes below the current selection. Maybe I need to change the datamodel somehow ...?
Regards, Thomas
PS: Thanks for the link to the 2 extensions. Unfortunately they are visualizing the whole tree and use a lot of space on the canvas.
- Mark as New
- Bookmark
- Subscribe
- Mute
- Subscribe to RSS Feed
- Permalink
- Report Inappropriate Content
Right, I get you, so you only need to show the nodes that are directly below? Probably the quickest and easiest way to achieve this is to set the dimension in the table to the drill down group itself, and maybe uncheck the "include null values" option to get rid of any nodes which don't have a value in that table.
Erica
- Mark as New
- Bookmark
- Subscribe
- Mute
- Subscribe to RSS Feed
- Permalink
- Report Inappropriate Content
So use these settings:
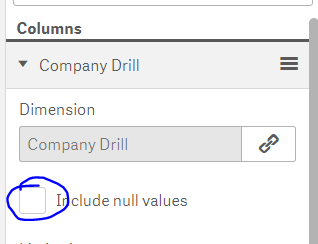
To get this in the chart - you may need to rename the dimension name
Erica
- Mark as New
- Bookmark
- Subscribe
- Mute
- Subscribe to RSS Feed
- Permalink
- Report Inappropriate Content
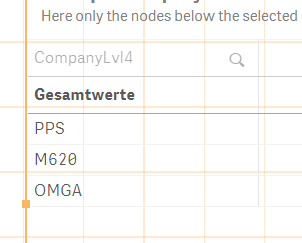
Sorry, but I can´t follow your solution. If already included the drill-down dimension in my table.
If I then select "AFP" and "OMIAL" (from the list box) ...

... all nodes below OMIAL are displayed in my table (but PPSGA and M621 shouldn´t).
In my case it doesn´t make a difference to check/uncheck "Include Null values" option.
How did you proceed only to see "PPS", "OMGA" and "M620" as shown in your screenshot?
- « Previous Replies
-
- 1
- 2
- Next Replies »