Unlock a world of possibilities! Login now and discover the exclusive benefits awaiting you.
- Qlik Community
- :
- Forums
- :
- Analytics
- :
- New to Qlik Analytics
- :
- Re: (QlikSense) Cashflow with values of different ...
- Subscribe to RSS Feed
- Mark Topic as New
- Mark Topic as Read
- Float this Topic for Current User
- Bookmark
- Subscribe
- Mute
- Printer Friendly Page
- Mark as New
- Bookmark
- Subscribe
- Mute
- Subscribe to RSS Feed
- Permalink
- Report Inappropriate Content
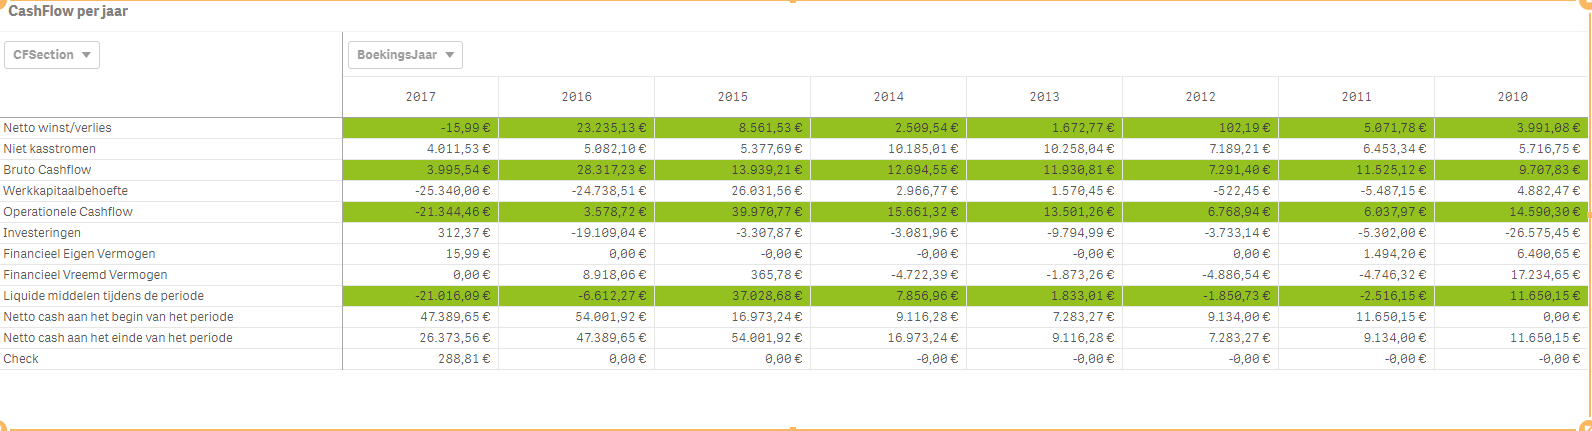
(QlikSense) Cashflow with values of different years or months
Hey
I need to make a Cashflow using a pivot table in Qlik Sense which let you see the values of all the different steps of the formula for the rows, and the period (year or months) on the columns.
I succeeded in making it for the years, but it doesn't work if i try this with the months.
To calculate the cashflow, you need values from your P&L and Balance sheet. You also need the values of the previous period in order to calculate it.
Does someone know how i can approach this the best way so that i can see the cashflow of every year and every month?
In the picture below you see how the cashflow of the years look like. I need the same with the months or, if possible, a period you select.
- Tags:
- cashflow
- in qliksense
- Mark as New
- Bookmark
- Subscribe
- Mute
- Subscribe to RSS Feed
- Permalink
- Report Inappropriate Content
Here is a simple cashflow app using a straight table but the principle is the same.