Unlock a world of possibilities! Login now and discover the exclusive benefits awaiting you.
- Qlik Community
- :
- All Forums
- :
- QlikView App Dev
- :
- Re: Avgs columns in Pivot table
- Subscribe to RSS Feed
- Mark Topic as New
- Mark Topic as Read
- Float this Topic for Current User
- Bookmark
- Subscribe
- Mute
- Printer Friendly Page
- Mark as New
- Bookmark
- Subscribe
- Mute
- Subscribe to RSS Feed
- Permalink
- Report Inappropriate Content
Avgs columns in Pivot table
Hi Qlikers,
I am facing a problems. Its related to pivot table.
In pivot table right now i can able to show sum(sales) by region and monthyear wise bifurcation.
Now my problem is i want to get the Averages for region wise As show in below image & highlighted in red color.
| Region | 2016-12 | 2017-01 | 2017-02 | 2017-03 | 2017-04 | 2017-05 | 2017-06 | 2017-07 | 2017-08 | 2017-09 | 2017-10 | 2017-11 | 2017-12 | AVG |
| East | 358 | 471 | 586 | 576 | 611 | 714 | 737 | 784 | 1,196 | 5,181 | 5,132 | 3,767 | 3,812 | 1,840 |
| West | 214 | 268 | 295 | 304 | 522 | 768 | 709 | 698 | 1,105 | 5,377 | 5,978 | 4,894 | 4,096 | 1,941 |
| South | 355 | 413 | 403 | 453 | 497 | 591 | 533 | 531 | 946 | 6,806 | 8,715 | 8,169 | 7,407 | 2,755 |
| North | 1,913 | 2,826 | 2,974 | 3,370 | 3,243 | 3,967 | 4,001 | 4,327 | 9,206 | 68,883 | 95,216 | 88,500 | 80,850 | 28,406 |
Dimensions : Region, MonthYear
Expression : Sum(Sales)
Kindly help on this how to achieve.
Thanks in Advance...
Accepted Solutions
- Mark as New
- Bookmark
- Subscribe
- Mute
- Subscribe to RSS Feed
- Permalink
- Report Inappropriate Content
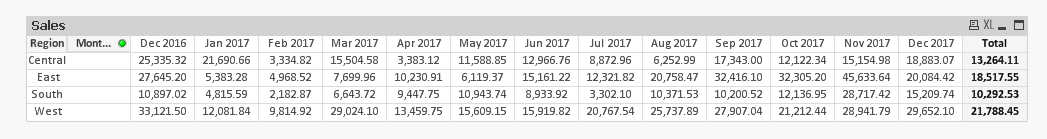
Look at the attached app and image....
My mistake when I said that add partial sum for Region... you needed to add it from MonthYear
- Mark as New
- Bookmark
- Subscribe
- Mute
- Subscribe to RSS Feed
- Permalink
- Report Inappropriate Content
May be try this
Avg(Aggr(Sum(Sales), Region, MonthYear))
and enable show partial sum for Region
- Mark as New
- Bookmark
- Subscribe
- Mute
- Subscribe to RSS Feed
- Permalink
- Report Inappropriate Content
Hi Sunny,
Thanks for the prompt response. But the expression is not worked for me.
For better understand, i want to show case the Sum(sales) & Avg's both are in same pivot table.
Kindly refer the table which i have attached in the original post.
Thanks & Regards,
Venkata Sreekanth
- Mark as New
- Bookmark
- Subscribe
- Mute
- Subscribe to RSS Feed
- Permalink
- Report Inappropriate Content
The expression I gave you should do that for you... is it not doing that? Would you be able to share a sample file where you are trying this out?
- Mark as New
- Bookmark
- Subscribe
- Mute
- Subscribe to RSS Feed
- Permalink
- Report Inappropriate Content
Hi Sunny,
Please find the sample application for your reference.
Thanks & Regards,
Venkata Sreekanth
- Mark as New
- Bookmark
- Subscribe
- Mute
- Subscribe to RSS Feed
- Permalink
- Report Inappropriate Content
Look at the attached app and image....
My mistake when I said that add partial sum for Region... you needed to add it from MonthYear
- Mark as New
- Bookmark
- Subscribe
- Mute
- Subscribe to RSS Feed
- Permalink
- Report Inappropriate Content
Hi Sunny,
Thanks for your response. With this sample application, it is solved my problem.
Thanks once again.
Thanks & Regards,
Venkata Sreekanth
- Mark as New
- Bookmark
- Subscribe
- Mute
- Subscribe to RSS Feed
- Permalink
- Report Inappropriate Content
Hi Sunny,
I'm sorry for this , again opening the same thread.
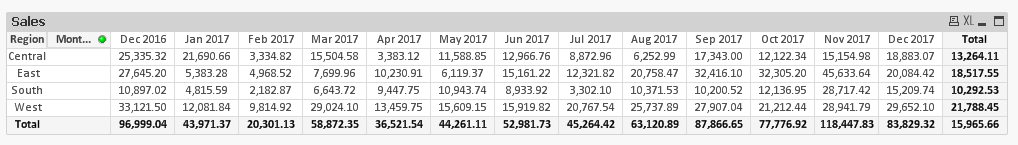
Till now we are good getting the AVG's on the end of the table. Now my another requirement is i want to get the Totals which i was shown in the sample below.
I mean on the MonthYear wise sums we have to show along with the AVG's in the same table. Is this possible ?
| Region | MonthYear | Dec 2016 | Jan 2017 | Feb 2017 | Mar 2017 | Apr 2017 | May 2017 | Jun 2017 | Jul 2017 | Aug 2017 | Sep 2017 | Oct 2017 | Nov 2017 | Dec 2017 | AVG |
| Central | 25,335 | 21,691 | 3,335 | 15,505 | 3,383 | 11,589 | 12,967 | 8,873 | 6,253 | 17,343 | 12,122 | 15,155 | 18,883 | 13,264 | |
| East | 27,645 | 5,383 | 4,969 | 7,700 | 10,231 | 6,119 | 15,161 | 12,322 | 20,758 | 32,416 | 32,305 | 45,634 | 20,084 | 18,518 | |
| South | 10,897 | 4,816 | 2,183 | 6,644 | 9,448 | 10,944 | 8,934 | 3,302 | 10,372 | 10,201 | 12,137 | 28,717 | 15,210 | 10,293 | |
| West | 33,122 | 12,082 | 9,815 | 29,024 | 13,460 | 15,609 | 15,920 | 20,768 | 25,738 | 27,907 | 21,212 | 28,942 | 29,652 | 21,788 | |
| Total | 96,999 | 43,971 | 20,301 | 58,872 | 36,522 | 44,261 | 52,982 | 45,264 | 63,121 | 87,867 | 77,777 | 118,448 | 83,829 |
Thanks & Regards,
Venkata Sreekanth
- Mark as New
- Bookmark
- Subscribe
- Mute
- Subscribe to RSS Feed
- Permalink
- Report Inappropriate Content
Try this
=If(SecondaryDimensionality() = 0, Avg(Aggr(Sum(Sales), Region, MonthYear)), Sum(Sales))
- Mark as New
- Bookmark
- Subscribe
- Mute
- Subscribe to RSS Feed
- Permalink
- Report Inappropriate Content
Hi Sunny,
Thanks for your prompt response. The condition is working properly
Thanks & Regards,
Venkata Sreekanth