Unlock a world of possibilities! Login now and discover the exclusive benefits awaiting you.
- Qlik Community
- :
- Forums
- :
- Analytics
- :
- New to Qlik Analytics
- :
- Re: Vertical Reference Lines work around needed
- Subscribe to RSS Feed
- Mark Topic as New
- Mark Topic as Read
- Float this Topic for Current User
- Bookmark
- Subscribe
- Mute
- Printer Friendly Page
- Mark as New
- Bookmark
- Subscribe
- Mute
- Subscribe to RSS Feed
- Permalink
- Report Inappropriate Content
Vertical Reference Lines work around needed
Hello Qlikers,
Do we have option to get Vertical Ref line? Sample attached
- Mark as New
- Bookmark
- Subscribe
- Mute
- Subscribe to RSS Feed
- Permalink
- Report Inappropriate Content
Andy - The idea you made may helps further rek's not for one. My business is different than what and where we are. But, to understand clear let's have a look in attached.
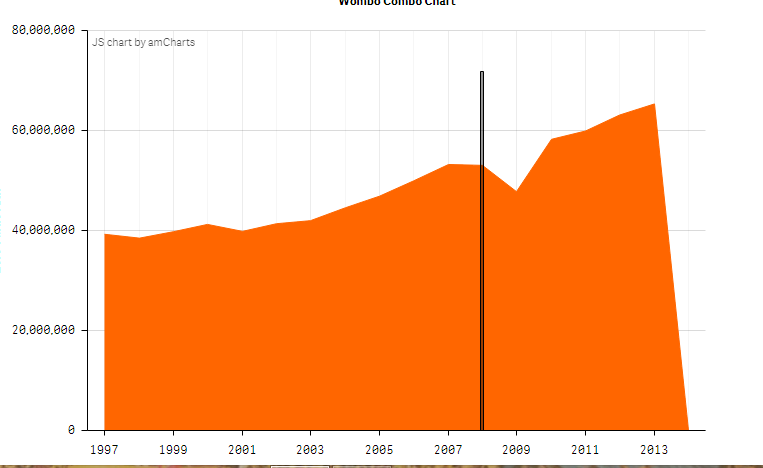
So, We have one dimension which periodically animation with Hours:Minute variation. So, I have 3 measures with Area plot. Now i would like to present with some vertical line. So we thought to get in in case if our standard time may cross from 4PM to 6 PM the line should move. That is what we have in View but not sure Why Sense not yet developed. In 2017 we got many versions with Patches none of them under developed this future.
Omar - Does Lines with Bar (Combo) can allot with Area plot?
Anyway, Would you like to share few inputs the same mto
- Mark as New
- Bookmark
- Subscribe
- Mute
- Subscribe to RSS Feed
- Permalink
- Report Inappropriate Content
The combo chart approach allows you to use the legend to give context but personally I think the coloured line looks cleaner and if you made it an area chart the effect would be shown even clearer. You could also add an image to explain the reason for the change in colour.
- Mark as New
- Bookmark
- Subscribe
- Mute
- Subscribe to RSS Feed
- Permalink
- Report Inappropriate Content
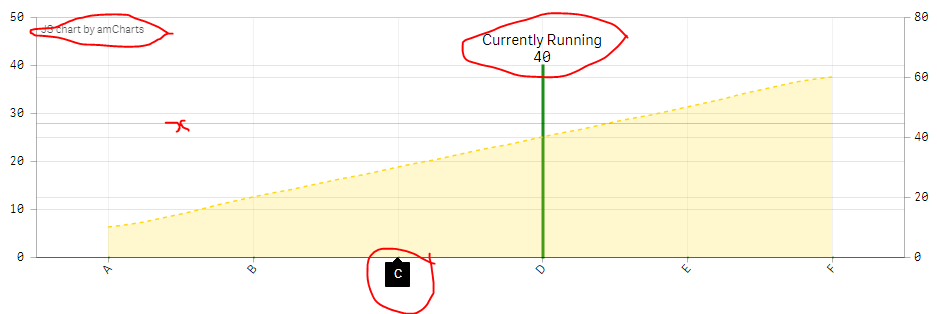
Try to use this extension Anil(u can control the bar width, I'll let u play with it to adjust it to ur needs):
example of use:
- Mark as New
- Bookmark
- Subscribe
- Mute
- Subscribe to RSS Feed
- Permalink
- Report Inappropriate Content
I've done this earlier(but useful) (The moment they are not happy with Extension). But, Now they are Okay to use.
Drawbacks by me not from product
1) If i want to disable popup and mouse over, Option not available (May be My eye power battery low)
2) The title graph looks "JS chart by anCharts" should disable, Even this is not available
3) The content of Bar Text should cover different color text.
Advantages
All are good, Until unless we can customize the JS and HTML script to make more better (This part i can handle)
- Mark as New
- Bookmark
- Subscribe
- Mute
- Subscribe to RSS Feed
- Permalink
- Report Inappropriate Content
Hi Anil / et al - I have entered this into our internal ideation system - the current work-arounds or extensions options are the way to go at this time.
Mike Tarallo
Qlik
- Mark as New
- Bookmark
- Subscribe
- Mute
- Subscribe to RSS Feed
- Permalink
- Report Inappropriate Content
We'll work on that!
- Mark as New
- Bookmark
- Subscribe
- Mute
- Subscribe to RSS Feed
- Permalink
- Report Inappropriate Content
omarbensalem , Will you get a chance to look ?
1st and 2nd resolved by using my own custom JS. 3rd is pending 
Again, I got few more drawbacks
1) Can we change X-Axis and Y-Axis Line (From Black - Gray)?
2) I would like to use Static Step like Min, Max and Step as QlikView?
- Mark as New
- Bookmark
- Subscribe
- Mute
- Subscribe to RSS Feed
- Permalink
- Report Inappropriate Content
Finally, Deserve using Native one without Vertical Reference Line and i realized there is some challenges using this box. So, I thought to convey them using Native and fine for them too. The only challenge even native can not be done for 3 Plot areas and One metric using plane line chart. So, We have some work around and achieved that using ARGB() ... So, I am going to close my response only
- Mark as New
- Bookmark
- Subscribe
- Mute
- Subscribe to RSS Feed
- Permalink
- Report Inappropriate Content
Hello
Without any extension I have tried to resolve your problem.
As i don't know how to add more information into the mousehover label, i chose to split information into a table and into a combochart
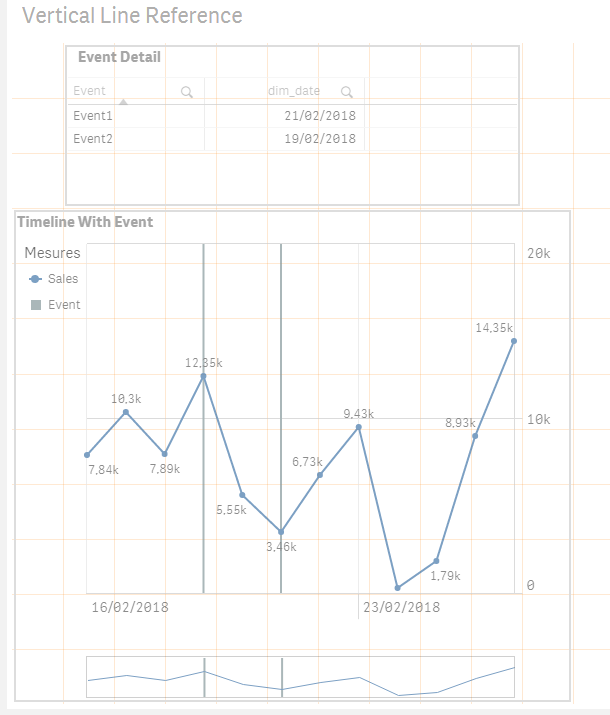
Hope it will be helpful !
- Mark as New
- Bookmark
- Subscribe
- Mute
- Subscribe to RSS Feed
- Permalink
- Report Inappropriate Content

expecting like above chart.
How can we get max value of scale for reference bar.i need the expression for max value of scale?
i need to create a bar reference for current date, so i used below formula:
if(date=today(),measure)
but bar is scaling till line i need full till max of scale.
