Unlock a world of possibilities! Login now and discover the exclusive benefits awaiting you.
- Qlik Community
- :
- Forums
- :
- Analytics
- :
- New to Qlik Analytics
- :
- Re: Create a line chart with total sales this week...
- Subscribe to RSS Feed
- Mark Topic as New
- Mark Topic as Read
- Float this Topic for Current User
- Bookmark
- Subscribe
- Mute
- Printer Friendly Page
- Mark as New
- Bookmark
- Subscribe
- Mute
- Subscribe to RSS Feed
- Permalink
- Report Inappropriate Content
Create a line chart with total sales this week compared to last week
Hey guys,
I have this table below:
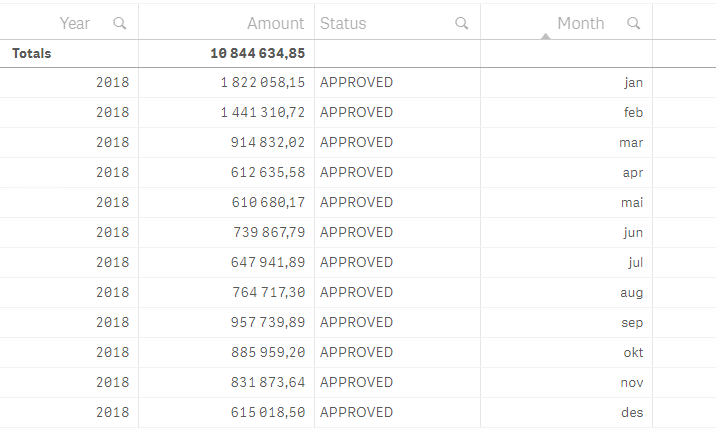
And what I am trying to do is I want it to show the total amount for the entire table on the row of jan 2018 and then as the total amount grows I want the next total amount on 2018 februar etc. as it goes.
The key here is that I want to know what is the total of amount today. And then I want to see what is the total amount at that day and be able to see the development on a line chart.
Is this something that I can solve / calculate front-end or would it best to make an aggregated table in the script and have that on the side?
Any suggestions is welcomed!
- « Previous Replies
-
- 1
- 2
- Next Replies »
- Mark as New
- Bookmark
- Subscribe
- Mute
- Subscribe to RSS Feed
- Permalink
- Report Inappropriate Content
the in january, the total year is basically : what u have sold in January?
and hen in February, u want to know how much did u sold in January AND february, and so on?
a cumulative vision of ur sales
- Mark as New
- Bookmark
- Subscribe
- Mute
- Subscribe to RSS Feed
- Permalink
- Report Inappropriate Content
No, because the amount is distributed throughout a year.
Imagine you sell a contract and the TOTAL CONTRACT WORTH is 200k.
We will get
100k in January
50k in February
When you look at how much did you sell for in January the total worth is 200k, but what we will be paid in January is 100k. So you have sold for 150k in January, but will be paid 100k in January and 50k in February.
hope I am explaining this in a ok way. Thanks for replying.
- Mark as New
- Bookmark
- Subscribe
- Mute
- Subscribe to RSS Feed
- Permalink
- Report Inappropriate Content
so in this case, in ur new measure:
what's the number u want to have in January?(100? 150?200?) and in February?(50?150?200?250?)
- Mark as New
- Bookmark
- Subscribe
- Mute
- Subscribe to RSS Feed
- Permalink
- Report Inappropriate Content
Well that really depends on the last 50k. Lets say that 50k is paid to us next year in January then for current year it would be 150k both in January and in February.
But
if another contract comes in January
that pays:
100k in January
50k March
and
100k January next year.
Then the total in January is 150k + 150k (from the new contract).
Next year the total in January would be.
50k + 100k because that is sold on previous contracts, but the actual amount that we will get in total in that month is 150k.
- « Previous Replies
-
- 1
- 2
- Next Replies »