Unlock a world of possibilities! Login now and discover the exclusive benefits awaiting you.
- Qlik Community
- :
- Forums
- :
- Analytics
- :
- New to Qlik Analytics
- :
- Re: Changing values from a Table to a Chart
- Subscribe to RSS Feed
- Mark Topic as New
- Mark Topic as Read
- Float this Topic for Current User
- Bookmark
- Subscribe
- Mute
- Printer Friendly Page
- Mark as New
- Bookmark
- Subscribe
- Mute
- Subscribe to RSS Feed
- Permalink
- Report Inappropriate Content
Changing values from a Table to a Chart
Hello Everyone,
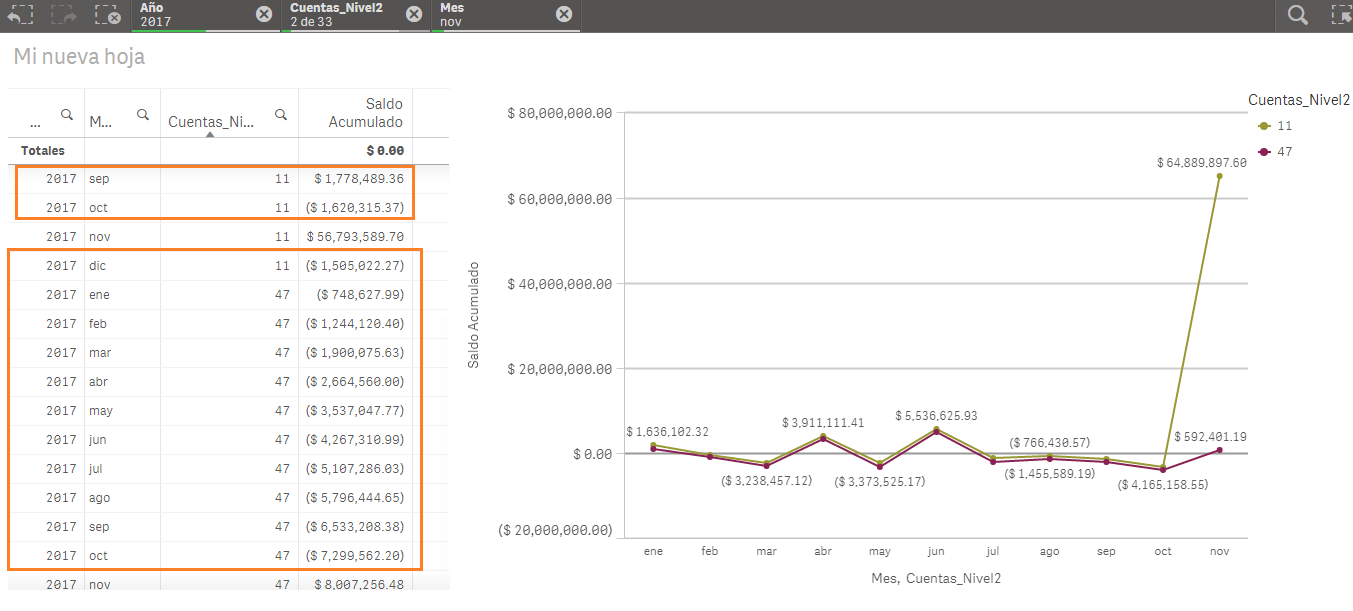
I need your help urgently. Does anyone know why making a table in a line graph the values change? It seems that I have to correct something in my advanced expression, because also, when selecting a Month, the table shows the incorrect values in the other months.
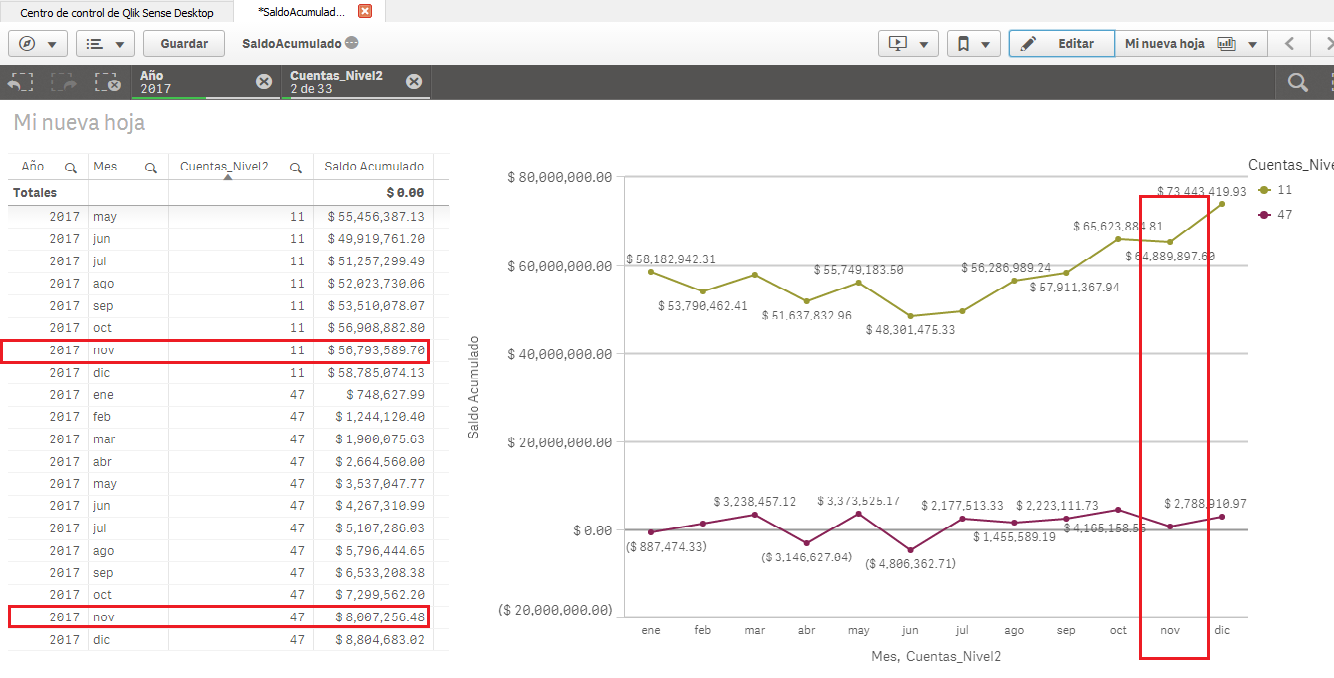
Any ideas to solve it? I attach a qvd so you can understand me better.
- Mark as New
- Bookmark
- Subscribe
- Mute
- Subscribe to RSS Feed
- Permalink
- Report Inappropriate Content
Hi Karen, i've downloaded your qvf and tried a little change at grid order. I suppose that if you use above() function, sort order in gird and chart must be the same.
With that change works for your example, but only with a filter by one year.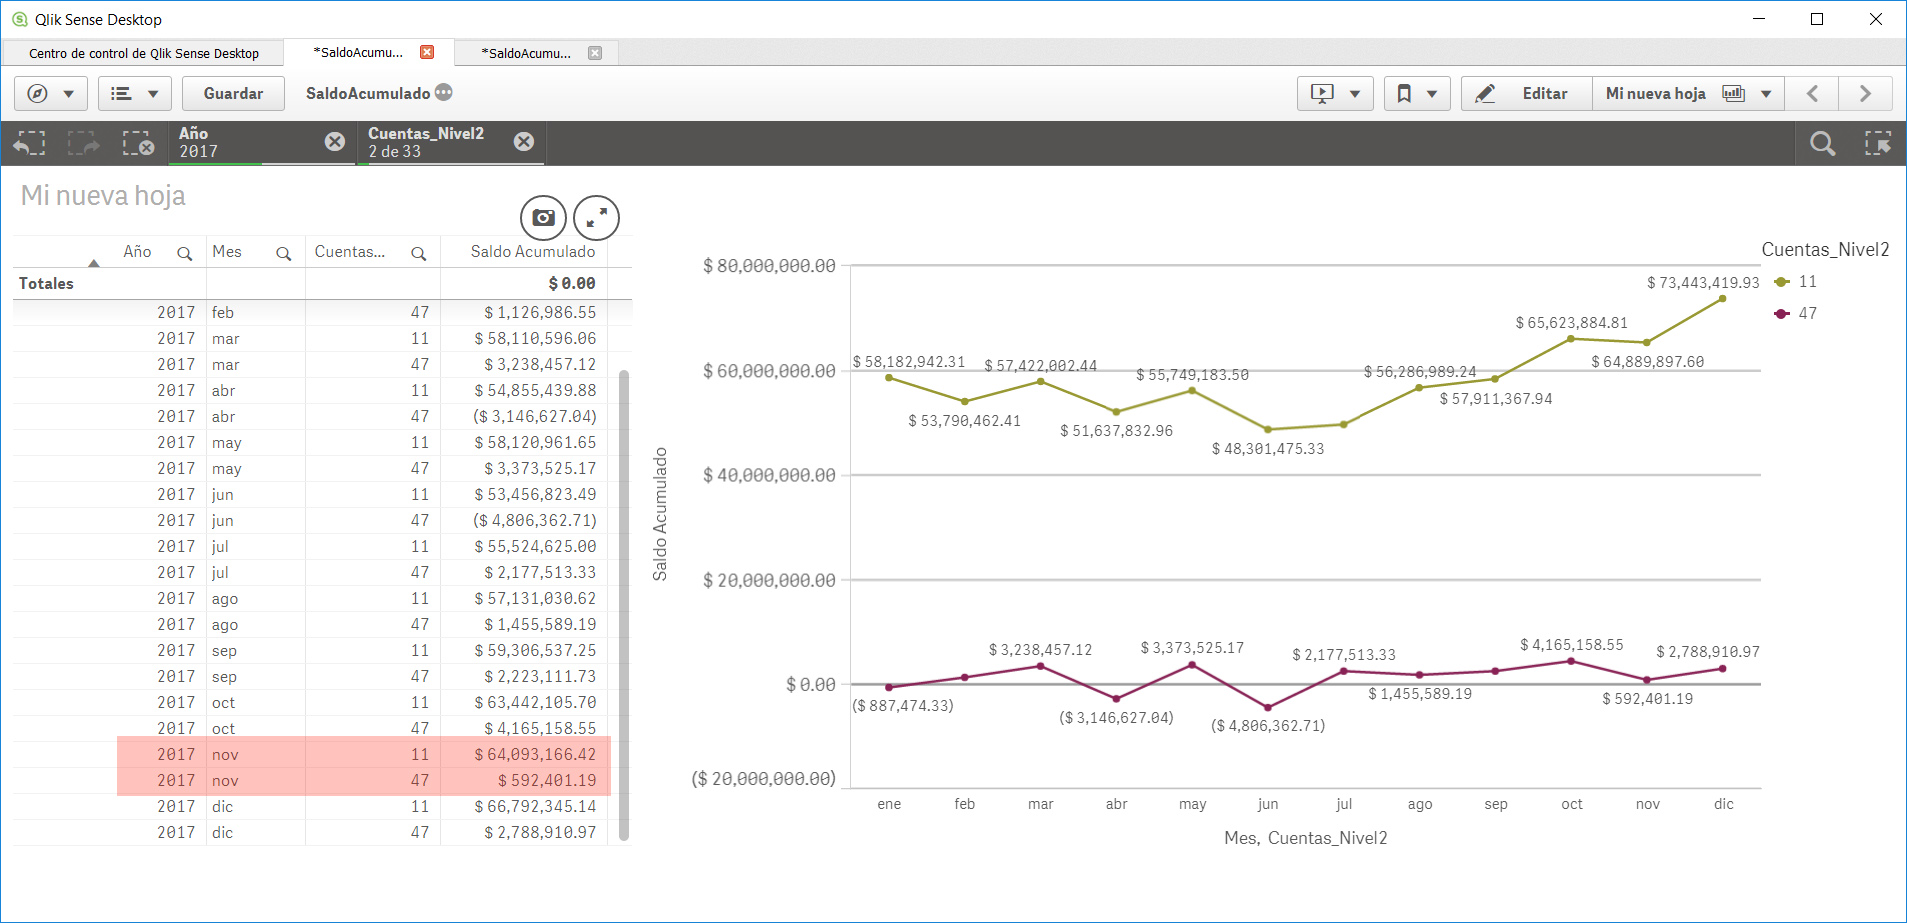
- Mark as New
- Bookmark
- Subscribe
- Mute
- Subscribe to RSS Feed
- Permalink
- Report Inappropriate Content
Thanks Fernando,
I see that a different value also appears for account 11 in the table and chart, but account 47 is already consistent. However, the change has been implemented completely changed the result, now the information is not correct. The values that were achieved before in the table are adequate. Is it possible to obtain a solution without altering the values I have from the table?
Thanks, I hope you can help me.
- Mark as New
- Bookmark
- Subscribe
- Mute
- Subscribe to RSS Feed
- Permalink
- Report Inappropriate Content
I think it will be hard (or not possible) obtain the right result with original sort in table.
The expression 'Saldo Acumulado' is a bit complex and perhaps it's better for error detection if you generate one or more agreggate tables with scripting, accumulating values by Año and Mes.
Obviously, this solution is not optimal for memory space, but it will divide complex formulas into easier ones, at least until you find the right results.