Unlock a world of possibilities! Login now and discover the exclusive benefits awaiting you.
- Qlik Community
- :
- Forums
- :
- Analytics
- :
- New to Qlik Analytics
- :
- Re: Subtract a Measure over two periods in Pivot T...
- Subscribe to RSS Feed
- Mark Topic as New
- Mark Topic as Read
- Float this Topic for Current User
- Bookmark
- Subscribe
- Mute
- Printer Friendly Page
- Mark as New
- Bookmark
- Subscribe
- Mute
- Subscribe to RSS Feed
- Permalink
- Report Inappropriate Content
Subtract a Measure over two periods in Pivot Table
Dear Experts,
I have a pivot table where i add period code in column and stock value is my measure where i can see my stock value comparison over two periods. Now i want to add the difference of stock value in two periods to show the variance.
Current
Stock Category DEC-17 JAN-18
A 100 110
B 200 210
C 300 310
Desire
Stock Category DEC-17 JAN-18 Variance
A 100 110 10
B 200 210 10
C 300 310 10
Regards,
Zahid Rahim
- Mark as New
- Bookmark
- Subscribe
- Mute
- Subscribe to RSS Feed
- Permalink
- Report Inappropriate Content
If you doing this in Pivot table you can try this.
=Column(2)-Column(1)
Thanks
- Mark as New
- Bookmark
- Subscribe
- Mute
- Subscribe to RSS Feed
- Permalink
- Report Inappropriate Content
you should create two measures for the two comparison periods, in order to have a third measure (variance) as Column(2)-Column(1).
use Stock category as the only one dimension.
- Mark as New
- Bookmark
- Subscribe
- Mute
- Subscribe to RSS Feed
- Permalink
- Report Inappropriate Content
Is Period Code a dimension? Also, if the first statement is true, are you going to always look at just two months at a time? If not, then how will your variance column look like if you have 5 months in your chart?
- Mark as New
- Bookmark
- Subscribe
- Mute
- Subscribe to RSS Feed
- Permalink
- Report Inappropriate Content
you have to add a measure by going to the Data Manager and then your new calculated measure from the two columns you want 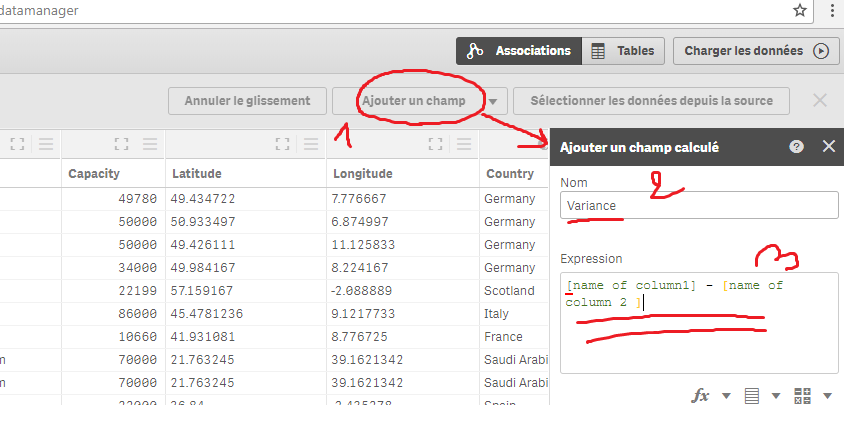
- Mark as New
- Bookmark
- Subscribe
- Mute
- Subscribe to RSS Feed
- Permalink
- Report Inappropriate Content
But this is not adding the new column. I am using the same expression in Pivot table