Unlock a world of possibilities! Login now and discover the exclusive benefits awaiting you.
- Qlik Community
- :
- Forums
- :
- Analytics
- :
- New to Qlik Analytics
- :
- Re: Bar chart in Qliksense
- Subscribe to RSS Feed
- Mark Topic as New
- Mark Topic as Read
- Float this Topic for Current User
- Bookmark
- Subscribe
- Mute
- Printer Friendly Page
- Mark as New
- Bookmark
- Subscribe
- Mute
- Subscribe to RSS Feed
- Permalink
- Report Inappropriate Content
Bar chart in Qliksense
Hi all,
I would need help on the stacked bar chart in qliksense.
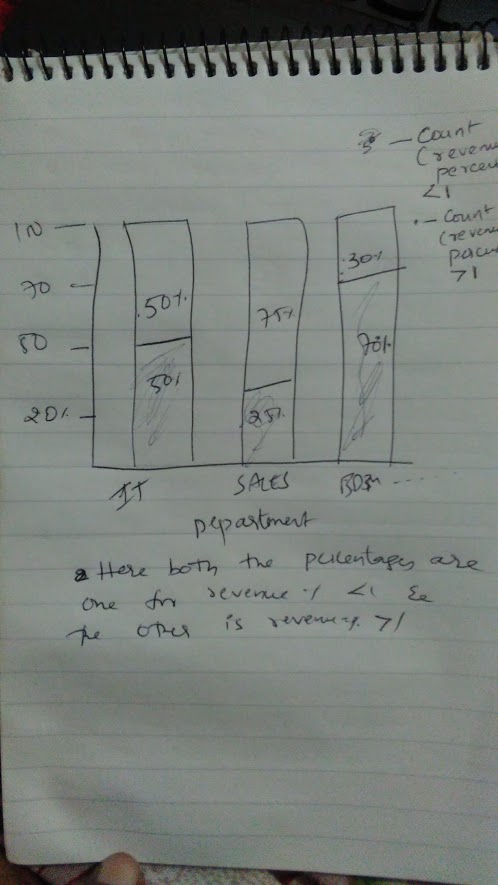
I have 3 columns of data i.e Department, Revenue Original, Revenue Estimated.
Now i have to calculate revenue ratio i.e revenue original / revenue estimated -
who calculate the percentage (revenue original/revenue estimate) / total of both sum and if the ratio is <1 make it revenue failure if not revenue failure.
and we need to count the number of revenue failure and revenue pass percentage.
those percentage graph should be on bar chart .
Ex is attached in the image and source spread sheet is also attached - please help me out
- « Previous Replies
-
- 1
- 2
- Next Replies »
- Mark as New
- Bookmark
- Subscribe
- Mute
- Subscribe to RSS Feed
- Permalink
- Report Inappropriate Content
any help
- Mark as New
- Bookmark
- Subscribe
- Mute
- Subscribe to RSS Feed
- Permalink
- Report Inappropriate Content
- Mark as New
- Bookmark
- Subscribe
- Mute
- Subscribe to RSS Feed
- Permalink
- Report Inappropriate Content
would it be sthing like this?
- Mark as New
- Bookmark
- Subscribe
- Mute
- Subscribe to RSS Feed
- Permalink
- Report Inappropriate Content
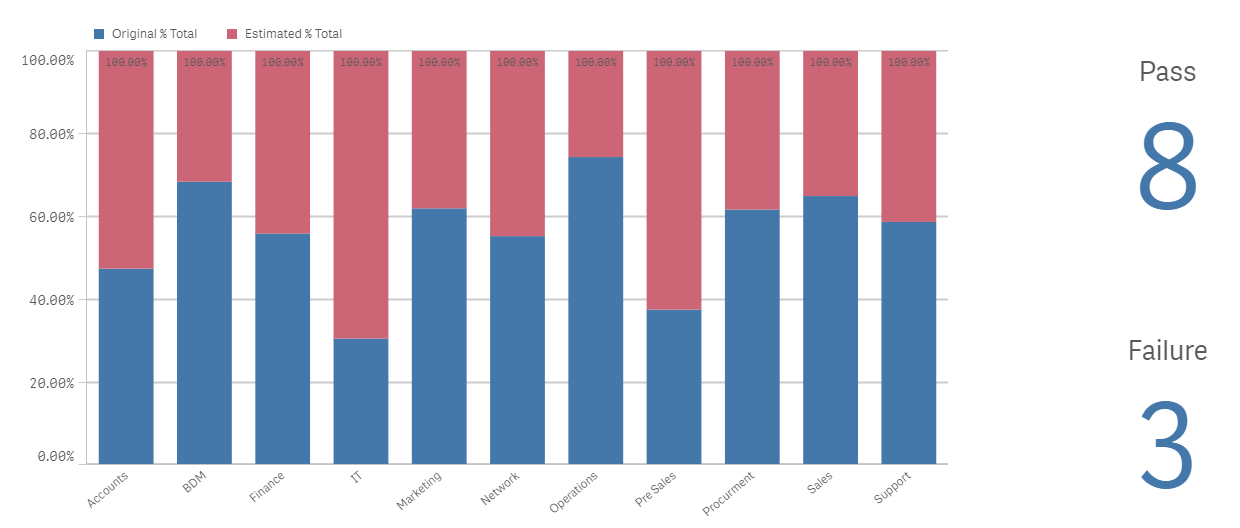
or like this?
To achieve this:
1) Use a bar chart
2) as a dimension : Department
3) as measures:
Original % Total:
Sum([Revenue Original]) / (sum({<Department>}[Revenue Estimated])+sum({<Department>}[Revenue Original]))
Estimated % Total:
Sum([Revenue Estimated]) / (sum({<Department>}[Revenue Estimated])+sum({<Department>}[Revenue Original]))
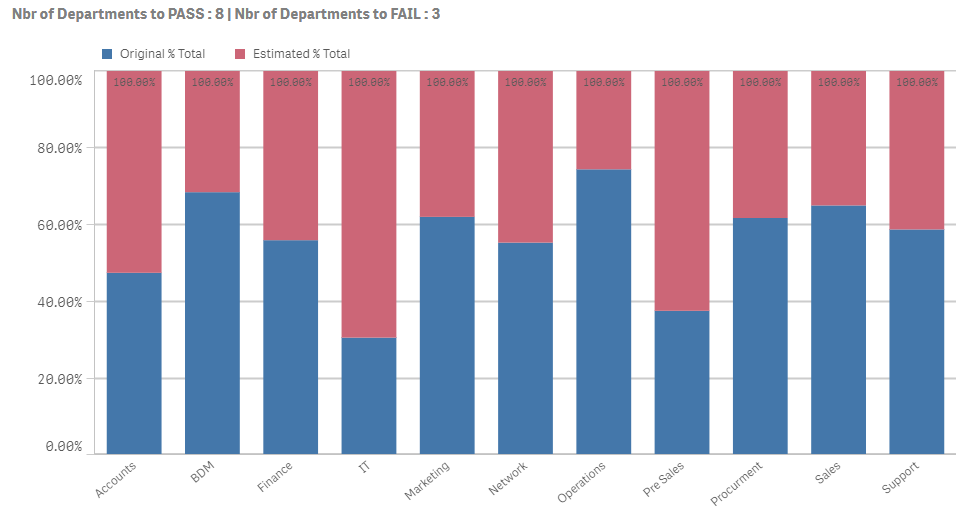
4) Under aspect > General : add a title as follow:
='Nbr of Departments to PASS : '&(count({<Department={"=(Sum([Revenue Original]) / sum([Revenue Estimated]))>1"}>}Department)) &' | Nbr of Departments to FAIL : '&(count({<Department={"=(Sum([Revenue Original]) / sum([Revenue Estimated]))<=1"}>}Department))
- Mark as New
- Bookmark
- Subscribe
- Mute
- Subscribe to RSS Feed
- Permalink
- Report Inappropriate Content
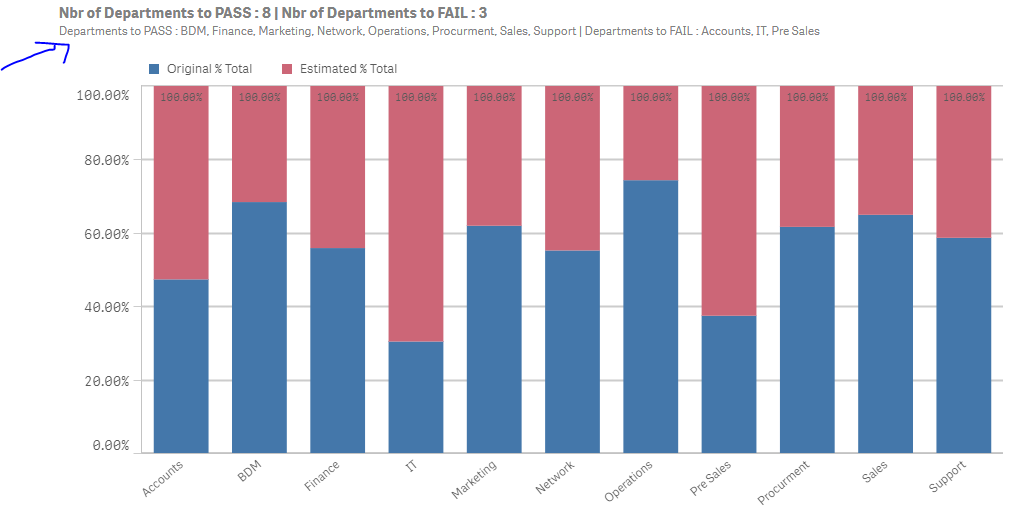
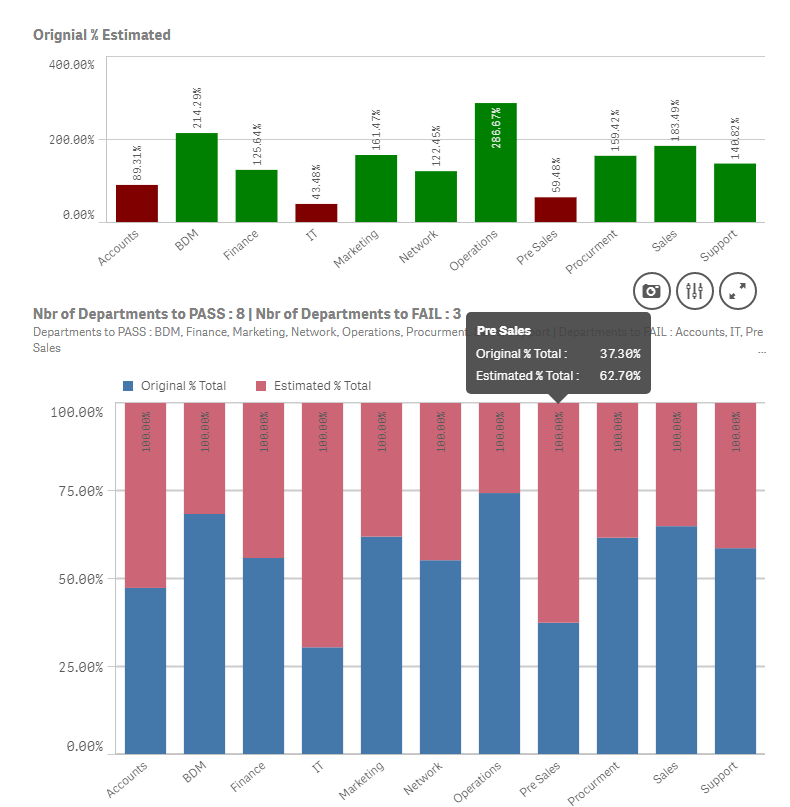
You can also add as a subtitle:
='Departments to PASS : '& concat
( aggr(only({<Department={"=(Sum([Revenue Original]) / sum([Revenue Estimated]))>1"}>}Department),Department),', ')
&
' | Departments to FAIL : '& concat
( aggr(only({<Department={"=(Sum([Revenue Original]) / sum([Revenue Estimated]))<=1"}>}Department),Department),', ')
to have also the list of departments that pass and fail:
- Mark as New
- Bookmark
- Subscribe
- Mute
- Subscribe to RSS Feed
- Permalink
- Report Inappropriate Content
You can also add yet another bar chart; to see how much was done by department compared to estimated:
Dimension: Department
Measure: Sum([Revenue Original]) / sum([Revenue Estimated])
and under aspect> colors > color by expression:
if(Sum([Revenue Original]) / sum([Revenue Estimated])>1,green(),red())
Result:
- Mark as New
- Bookmark
- Subscribe
- Mute
- Subscribe to RSS Feed
- Permalink
- Report Inappropriate Content
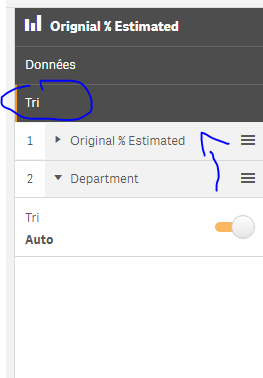
If u want to sort the 2 charts, by the percentage of realisation (original % estimated):
1) in the first chart; under the sort tab: put the measure above the dimension:
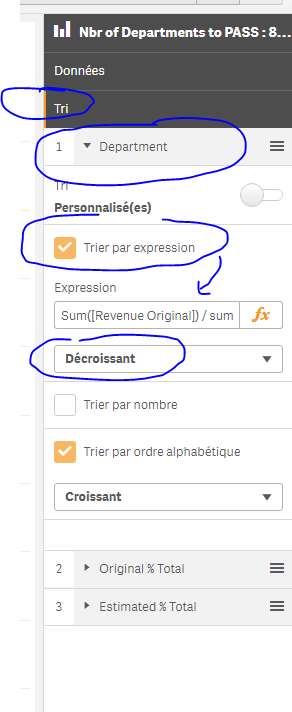
2) in the second bar chart; under the sort tab; sort the dimension Department by expression (descending):
Sum([Revenue Original]) / sum([Revenue Estimated])
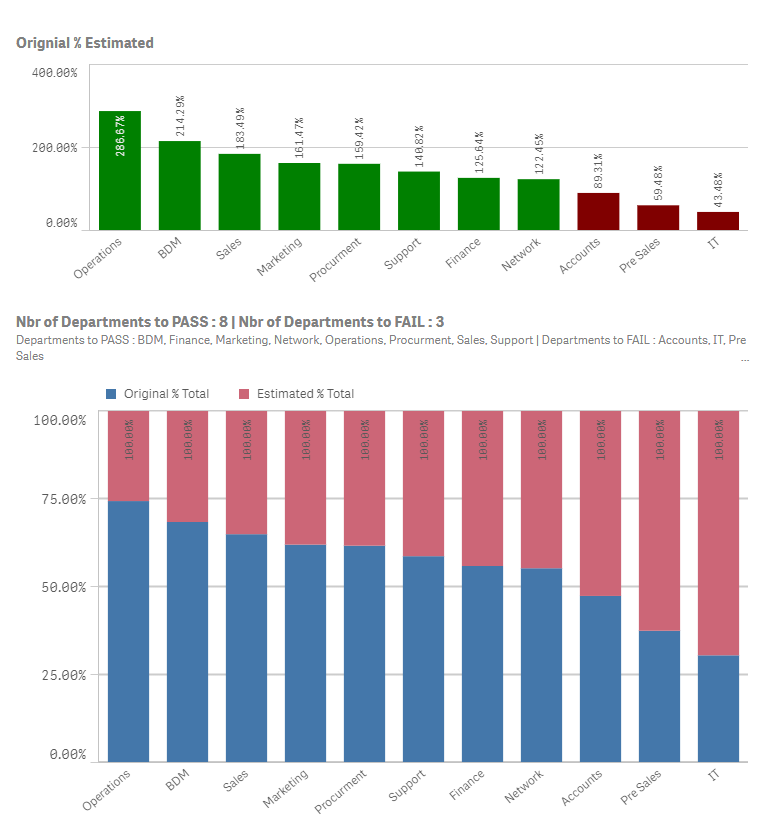
result:
- Mark as New
- Bookmark
- Subscribe
- Mute
- Subscribe to RSS Feed
- Permalink
- Report Inappropriate Content
thanks for this detailed explanation but however for each department we need to find out how many fail or pass not on whole departments-
hope you understand if not please let me know
each department wise i need how many failure or pass percentage --
i,e for each department consider 8 pass and 4 failure (so pass % would be around 60-70% and failure would be 30%)
hope this can be done and let me know
- « Previous Replies
-
- 1
- 2
- Next Replies »