Unlock a world of possibilities! Login now and discover the exclusive benefits awaiting you.
- Qlik Community
- :
- Forums
- :
- Analytics
- :
- New to Qlik Analytics
- :
- Re: Sum of the same companies in different years
- Subscribe to RSS Feed
- Mark Topic as New
- Mark Topic as Read
- Float this Topic for Current User
- Bookmark
- Subscribe
- Mute
- Printer Friendly Page
- Mark as New
- Bookmark
- Subscribe
- Mute
- Subscribe to RSS Feed
- Permalink
- Report Inappropriate Content
Sum of the same companies in different years
Hello,
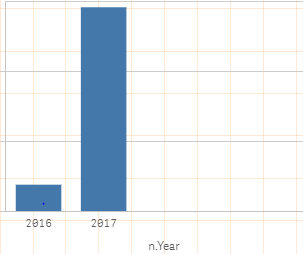
I have different companies in different years. I want to calculate the sum of the same companies in the bar chart. The sum also should be for the max date.Bar should look like this
- « Previous Replies
-
- 1
- 2
- Next Replies »
- Mark as New
- Bookmark
- Subscribe
- Mute
- Subscribe to RSS Feed
- Permalink
- Report Inappropriate Content
Company 43 is added in 2017
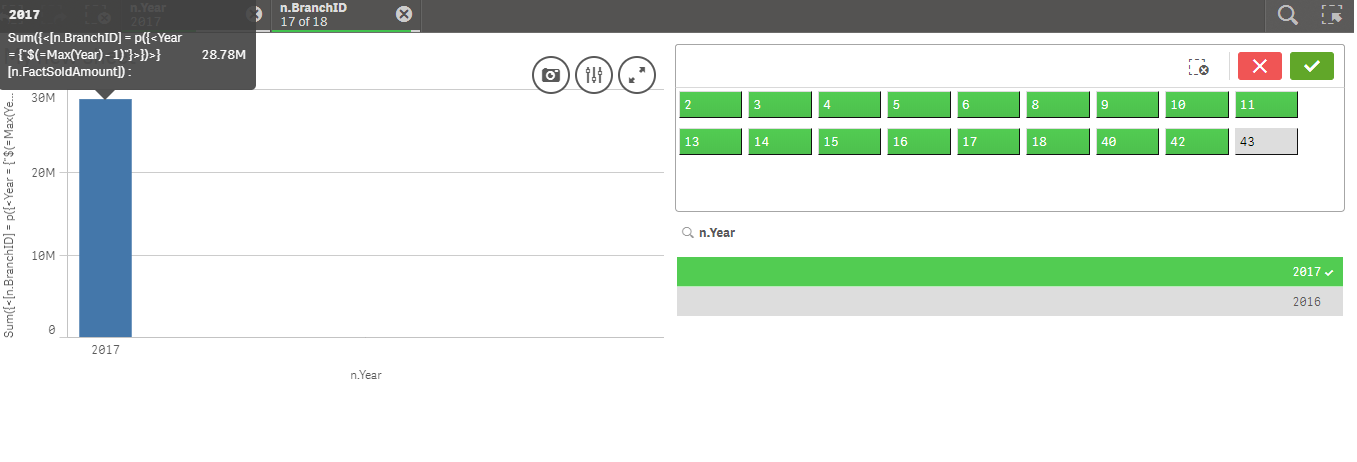
So, here are the screenshots . Sum Should be 28.78 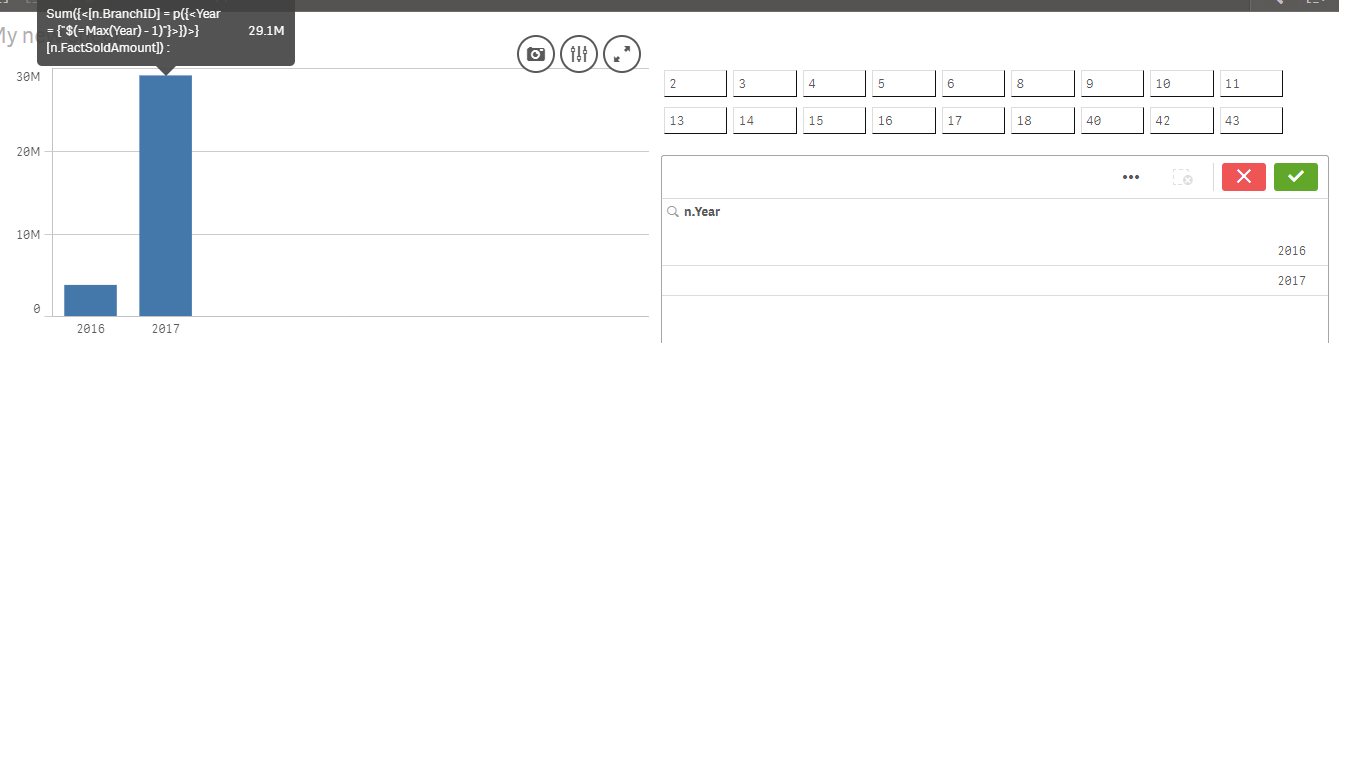
- Mark as New
- Bookmark
- Subscribe
- Mute
- Subscribe to RSS Feed
- Permalink
- Report Inappropriate Content
Isn't your year field called n.year? I am not sure if you need to change your set analysis to make sure it is n.year 
- Mark as New
- Bookmark
- Subscribe
- Mute
- Subscribe to RSS Feed
- Permalink
- Report Inappropriate Content
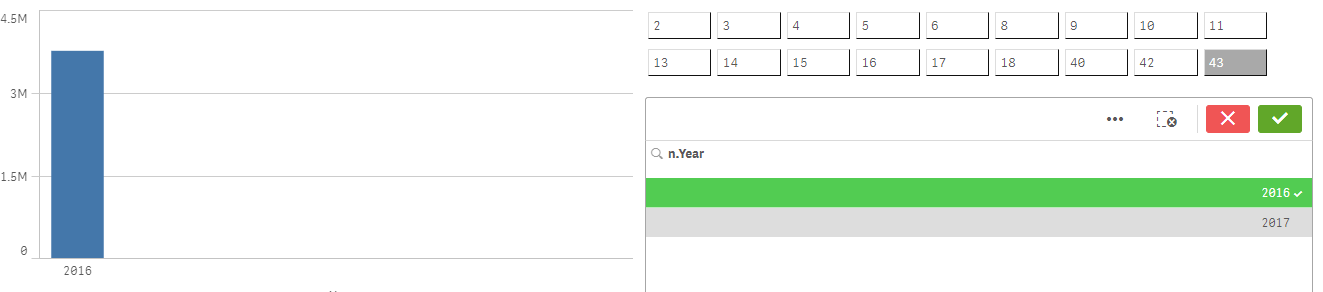
It works correctly, also when I click 2017 , everything is shown.
But when I click 2016 it doesn't work
- Mark as New
- Bookmark
- Subscribe
- Mute
- Subscribe to RSS Feed
- Permalink
- Report Inappropriate Content
What doesn't work? Can you share a sample and explain what you need?
- Mark as New
- Bookmark
- Subscribe
- Mute
- Subscribe to RSS Feed
- Permalink
- Report Inappropriate Content
i think you want the sum for each companie displayed for each year , for example :
2016 A 50000
B 60000
C 59000
2017 A 100000
B 80000
C 55000
X 70000
if you want like that you have to add two dimensions one for year and second for Companies and in the measure add sum(field)
- Mark as New
- Bookmark
- Subscribe
- Mute
- Subscribe to RSS Feed
- Permalink
- Report Inappropriate Content
Hope it may help you,
- Mark as New
- Bookmark
- Subscribe
- Mute
- Subscribe to RSS Feed
- Permalink
- Report Inappropriate Content
May be, you don't have 2015 data, so it shows nothing when you click 2016, what if you change it to Min(Year)? -
Sum({<Company = p({<Year = {"$(=Min(Year)"}>})>}Measure)
- Mark as New
- Bookmark
- Subscribe
- Mute
- Subscribe to RSS Feed
- Permalink
- Report Inappropriate Content
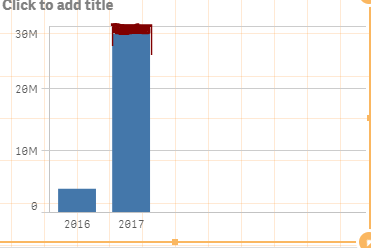
Can I make the bar chart and and show new the new company as it is in this picture?
- Mark as New
- Bookmark
- Subscribe
- Mute
- Subscribe to RSS Feed
- Permalink
- Report Inappropriate Content
Can I make the bar chart and and show the new company as it is in this picture?

- Mark as New
- Bookmark
- Subscribe
- Mute
- Subscribe to RSS Feed
- Permalink
- Report Inappropriate Content
I think you can... would you be able to share a sample app?
- « Previous Replies
-
- 1
- 2
- Next Replies »