Unlock a world of possibilities! Login now and discover the exclusive benefits awaiting you.
- Qlik Community
- :
- Forums
- :
- Analytics
- :
- New to Qlik Analytics
- :
- Re: Formulas in Script
- Subscribe to RSS Feed
- Mark Topic as New
- Mark Topic as Read
- Float this Topic for Current User
- Bookmark
- Subscribe
- Mute
- Printer Friendly Page
- Mark as New
- Bookmark
- Subscribe
- Mute
- Subscribe to RSS Feed
- Permalink
- Report Inappropriate Content
Formulas in Script
Hi Guys,
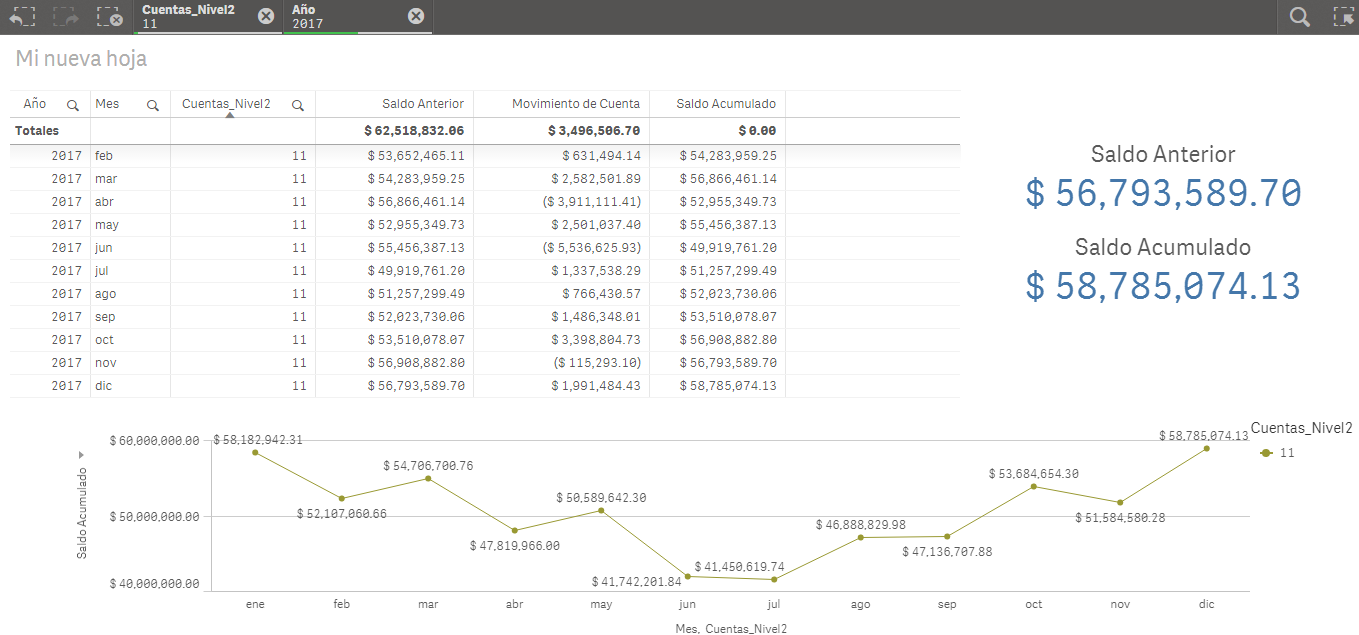
Is there any possibility of implementing the formulas I have in the table in the script? because as you can see the values are altered in the trend graph and in the KPIs I had to use another formula to show me the correct values. The values that I have in the table are the ones that are correct. Help me please, I'm going crazy!
- Mark as New
- Bookmark
- Subscribe
- Mute
- Subscribe to RSS Feed
- Permalink
- Report Inappropriate Content
Are you expecting total of the tables in KPIs? Total doesn't look the Sum of values?
you may try using Sum(Aggr in KPIs to replicate the table formula like this -
Sum(Aggr(If( Identificador_Cuenta = 'Deudora',
If( Acumula_Saldo = '1',
RangeSum(Sum({<Mes={'ene'}, Año = {'2016'}>}Saldo_Anterior),
Above(total
Sum({<Año =, Mes=>}Saldo_Anterior)+
(Sum({<Año=, Tipo_Cuenta = {'D'}>}Valor_Cuenta)
- Sum({<Año=, Tipo_Cuenta = {'C'}>}Valor_Cuenta))
,1, RowNo(total)))
,
RangeSum(
Above(
(Sum({<Tipo_Cuenta = {'D'}>}Valor_Cuenta)
- Sum({<Tipo_Cuenta = {'C'}>}Valor_Cuenta))
,1, RowNo()))
)
,
If( Acumula_Saldo = '1',
RangeSum(
Above(total
Sum({<Mes={'ene'}, Año = {'2016'}>}Saldo_Anterior)+
(Sum({<Año=, Tipo_Cuenta = {'C'}>}Valor_Cuenta)
- Sum({<Año=, Tipo_Cuenta = {'D'}>}Valor_Cuenta))
,1, RowNo(total)))
,
RangeSum(
Above(
(Sum({<Tipo_Cuenta = {'C'}>}Valor_Cuenta)
- Sum({<Tipo_Cuenta = {'D'}>}Valor_Cuenta))
,1, RowNo()))
)
),Año,Mes,Cuentas_Nivel2))
When I changed table total to Sum in the properties, values matched with KPI value.
- Mark as New
- Bookmark
- Subscribe
- Mute
- Subscribe to RSS Feed
- Permalink
- Report Inappropriate Content
Thanks for your comment, but why the values are correct only when I get a selection? Is there any way to see the values in the table without any selection?
- Mark as New
- Bookmark
- Subscribe
- Mute
- Subscribe to RSS Feed
- Permalink
- Report Inappropriate Content
Your expressions appears very complex to me. I prefer putting all possible logic in Script and creating flags which can be used to calculate measures very easily using set expression like Sum({<Flag = {1} >}Value). Replicating table expressions for KPI and for other charts indicates you may have opportunity to move some logic to script or create variables which can be used at multiple places.
- Mark as New
- Bookmark
- Subscribe
- Mute
- Subscribe to RSS Feed
- Permalink
- Report Inappropriate Content
 That's fine! Thank you! I get more than 2 months trying to solve this problem.