Unlock a world of possibilities! Login now and discover the exclusive benefits awaiting you.
- Qlik Community
- :
- Forums
- :
- Analytics
- :
- New to Qlik Analytics
- :
- Re: Charts which are only affected by one filter (...
- Subscribe to RSS Feed
- Mark Topic as New
- Mark Topic as Read
- Float this Topic for Current User
- Bookmark
- Subscribe
- Mute
- Printer Friendly Page
- Mark as New
- Bookmark
- Subscribe
- Mute
- Subscribe to RSS Feed
- Permalink
- Report Inappropriate Content
Charts which are only affected by one filter (Qlik Sense)
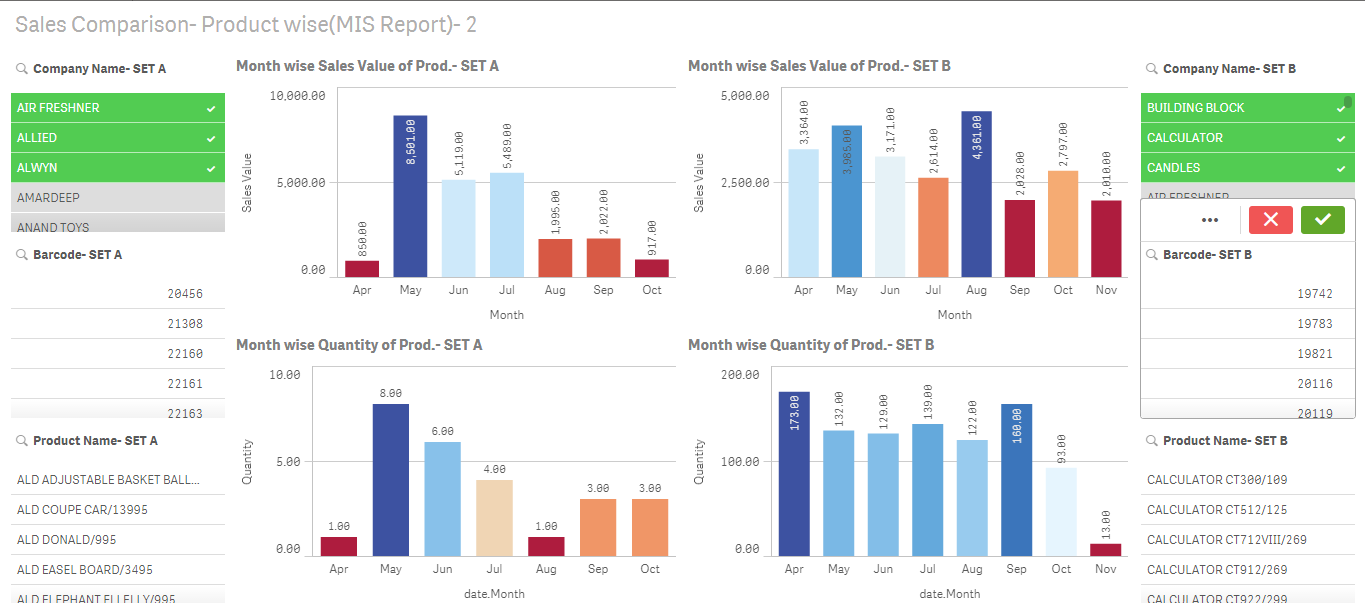
I am creating multiple bar charts
But i want to be able to compare these charts
I want to have 2 filter panes and 2 bar charts
1 bar chart being affected by filter 1 and chart the second chart being affected by filter 2
So that a comparison can be made
If this is possible help would be appreciated
Thank you
- Mark as New
- Bookmark
- Subscribe
- Mute
- Subscribe to RSS Feed
- Permalink
- Report Inappropriate Content
I think you are looking for alternate state in Qlik Sense.
You should have two data islands with values to use in filters.
Then try to get result using P function.
Please see solution Using Alternate State in QLikSense (without Extensions)
- Mark as New
- Bookmark
- Subscribe
- Mute
- Subscribe to RSS Feed
- Permalink
- Report Inappropriate Content
If you don't want to use alternate state, you can create two separate island tables for your filter fields( In script), with separate alias name.
In your bar chart, you can use set analysis in the measure expressions to filter records based on selections in the filter pane made out of island field names. Like below -
Sum({<facttablefield = {$(=GetFieldSelections(Islandtablefield,',',240))}>}Sales)
- Mark as New
- Bookmark
- Subscribe
- Mute
- Subscribe to RSS Feed
- Permalink
- Report Inappropriate Content
Hi Michael,
You need Alternate States. As already suggested you can use Island tables or use an extension. I've used an extension to achieve the same like below.
Extension link: Qlik Branch
Regards,
Arjun