Unlock a world of possibilities! Login now and discover the exclusive benefits awaiting you.
- Qlik Community
- :
- Forums
- :
- Analytics
- :
- New to Qlik Analytics
- :
- Re: Issue with BarChart - Qliksense
- Subscribe to RSS Feed
- Mark Topic as New
- Mark Topic as Read
- Float this Topic for Current User
- Bookmark
- Subscribe
- Mute
- Printer Friendly Page
- Mark as New
- Bookmark
- Subscribe
- Mute
- Subscribe to RSS Feed
- Permalink
- Report Inappropriate Content
Issue with BarChart - Qliksense
Hi All,
I create BarChart with 2 dimensions - Sales and Quarter and 1 measure - Amount.
I create filter in the measure so it displays the last three quarters:
count({$<PERIOD={'$(=$(vPERIOD_MAX))','$(=$(vPERIOD_MAX2))','$(=$(vPERIOD_MAX1))'}>}Sales)
The graph display the last 3 quarter but in the legend it display everything and doesn't filter the last 3 quarter...
Could you please advise?
Thank you,
Ruti.
- Mark as New
- Bookmark
- Subscribe
- Mute
- Subscribe to RSS Feed
- Permalink
- Report Inappropriate Content
that is strange, may be if you can share a sample it might help to see what might be going wrong? Or not sure, but if omarbensalem have any ideas here
- Mark as New
- Bookmark
- Subscribe
- Mute
- Subscribe to RSS Feed
- Permalink
- Report Inappropriate Content
Yes, Qlik won't adapt the quarters in the legends..
I'll suggest u to change ur dimension from
Quarter to:
if(PERIOD='$(=$(vPERIOD_MAX))' or PERIOD='$(=$(vPERIOD_MAX1))' or PERIOD='$(=$(vPERIOD_MAX)2)',Quarter)
Example: per analogy :
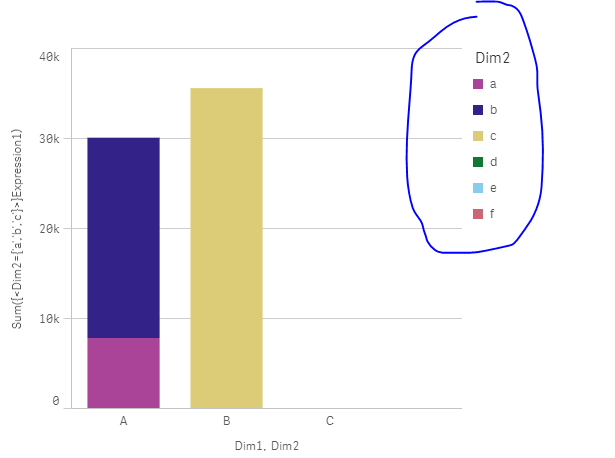
even though my expression is sum({<Dim2={'a','b','c'}>}Expression1)
all the Dim2 values are shown in th chart
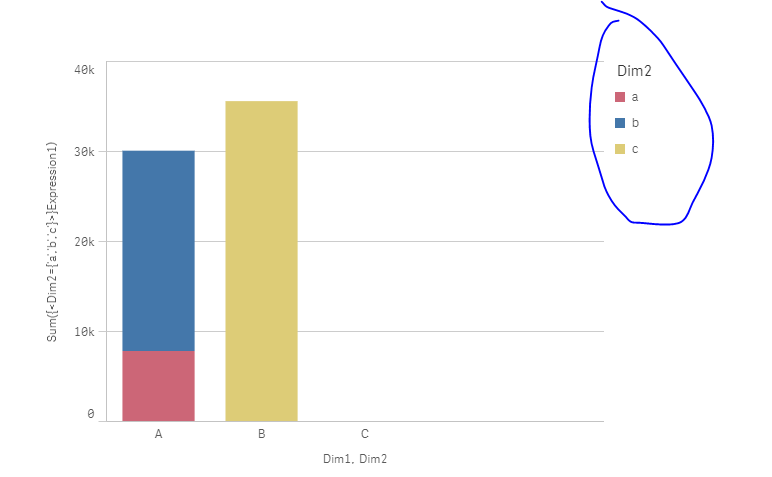
But if I change the dimension from Dim2 to :
=if(Dim2='a' or Dim2='b' or Dim2='c',Dim2)
The result would become:
- Mark as New
- Bookmark
- Subscribe
- Mute
- Subscribe to RSS Feed
- Permalink
- Report Inappropriate Content
This is strange, seems like a bug, right?
- Mark as New
- Bookmark
- Subscribe
- Mute
- Subscribe to RSS Feed
- Permalink
- Report Inappropriate Content
Yes.. seems to me.. mto; can u look at this please?
- Mark as New
- Bookmark
- Subscribe
- Mute
- Subscribe to RSS Feed
- Permalink
- Report Inappropriate Content
Thank you for your response ..
I remember that It's worked in the past like I developed...