Unlock a world of possibilities! Login now and discover the exclusive benefits awaiting you.
- Qlik Community
- :
- Forums
- :
- Analytics
- :
- New to Qlik Analytics
- :
- Re: Line Chart: running total with multiple dimens...
- Subscribe to RSS Feed
- Mark Topic as New
- Mark Topic as Read
- Float this Topic for Current User
- Bookmark
- Subscribe
- Mute
- Printer Friendly Page
- Mark as New
- Bookmark
- Subscribe
- Mute
- Subscribe to RSS Feed
- Permalink
- Report Inappropriate Content
Line Chart: running total with multiple dimensions (month, year)
Dimension1: Month
Dimension2: Year
Measure: Eur_commission (amount)
I can calculate running total with 1 dimension only (month) using the formula:
Rangesum( Above(Sum(eur_commission), 0, RowNo()))
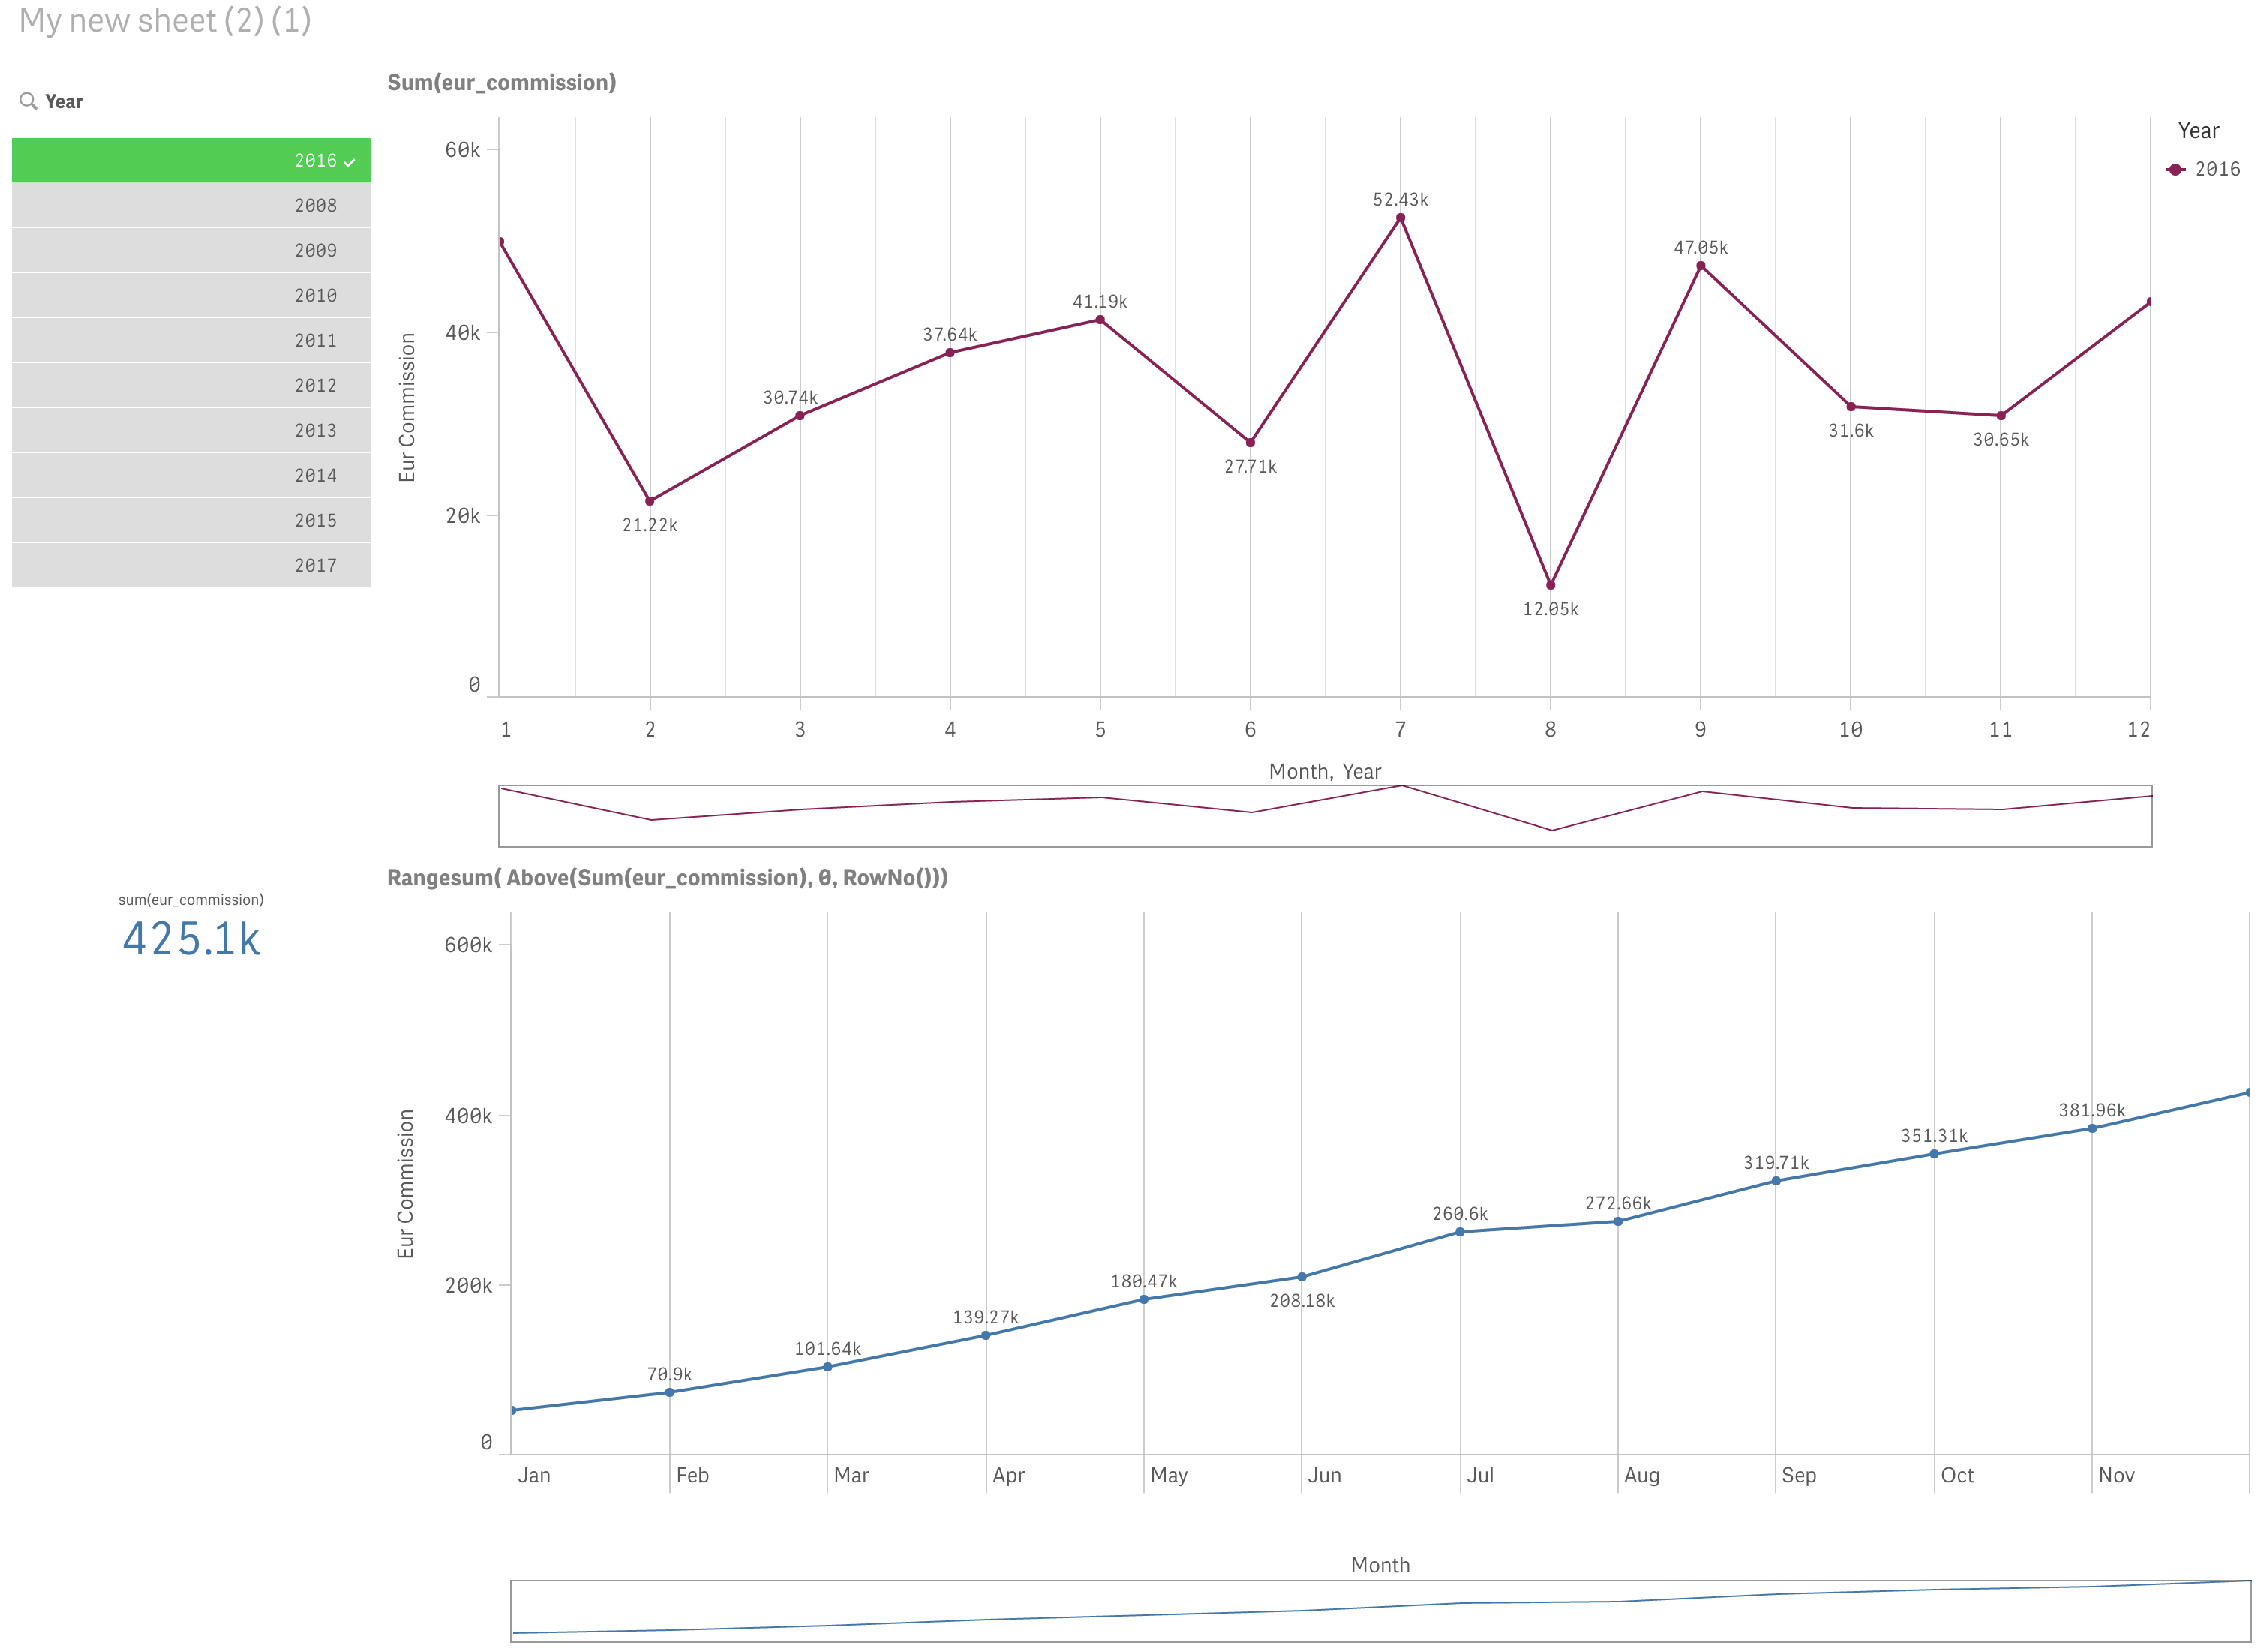
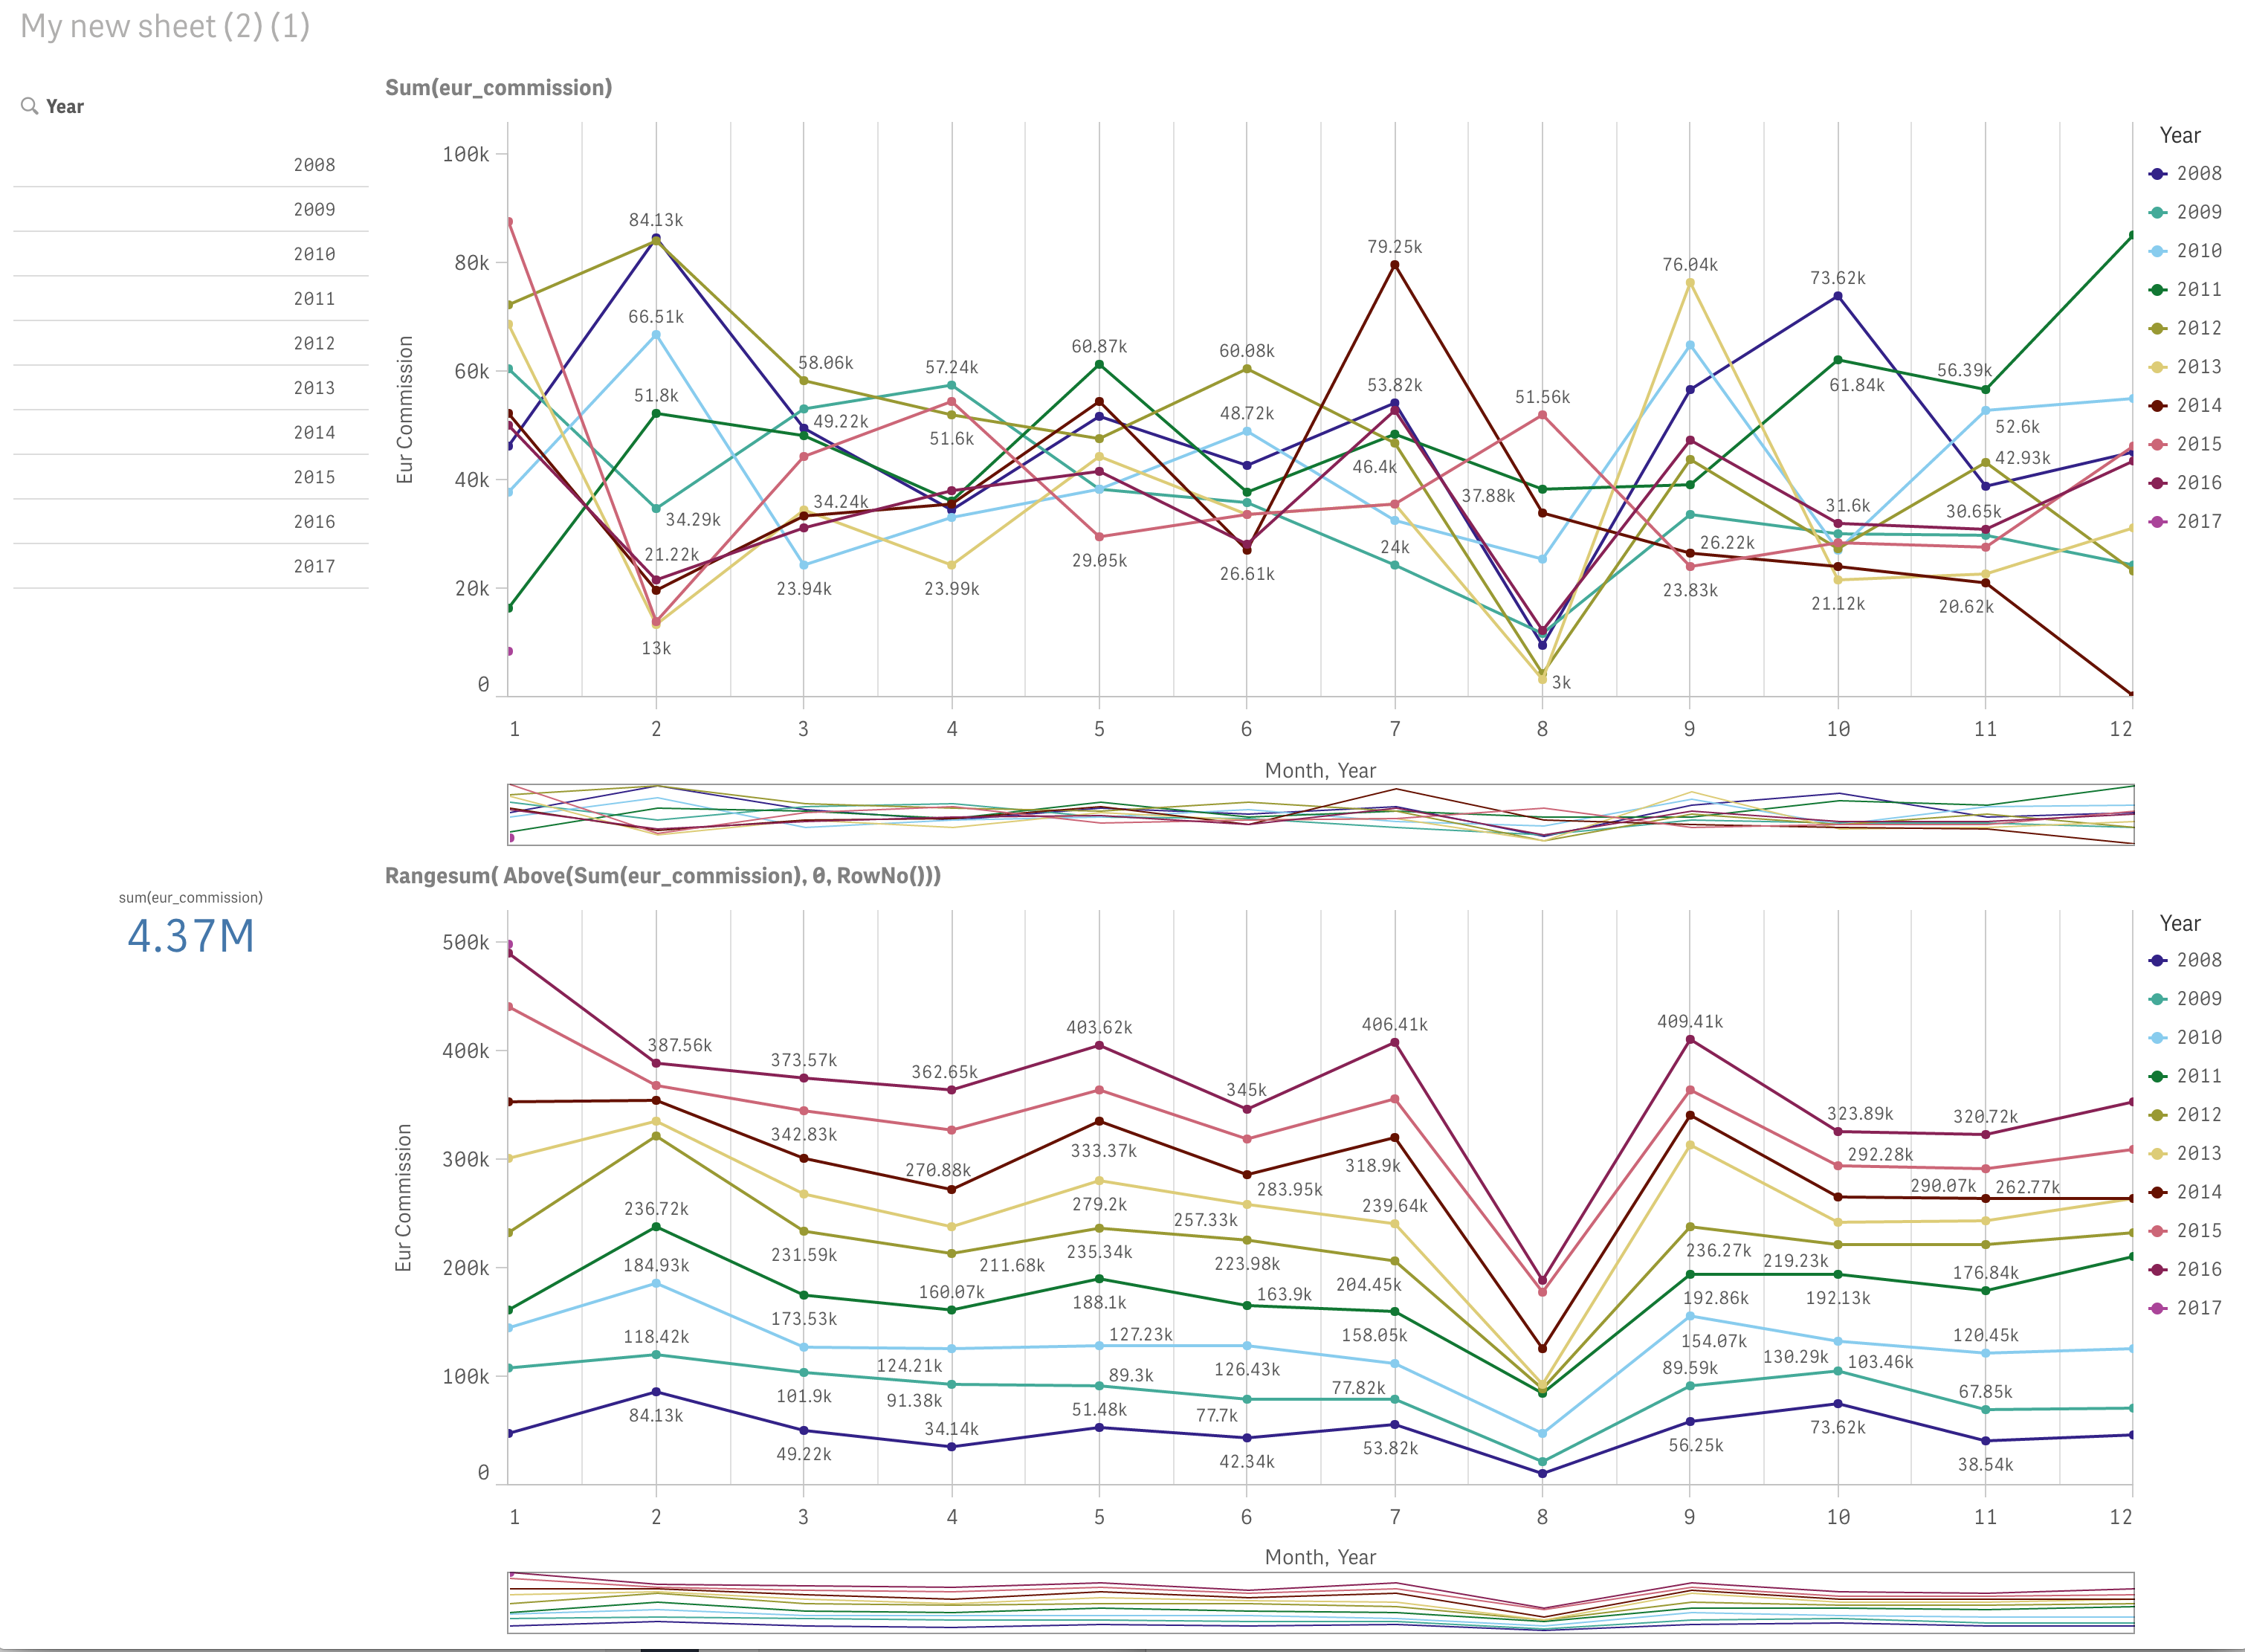
If I add the second dimension (Year), the top chart (no running total) is perfect, the bottom chart (running total)
doesn't work anymore.
- Mark as New
- Bookmark
- Subscribe
- Mute
- Subscribe to RSS Feed
- Permalink
- Report Inappropriate Content
Hi Sunny,
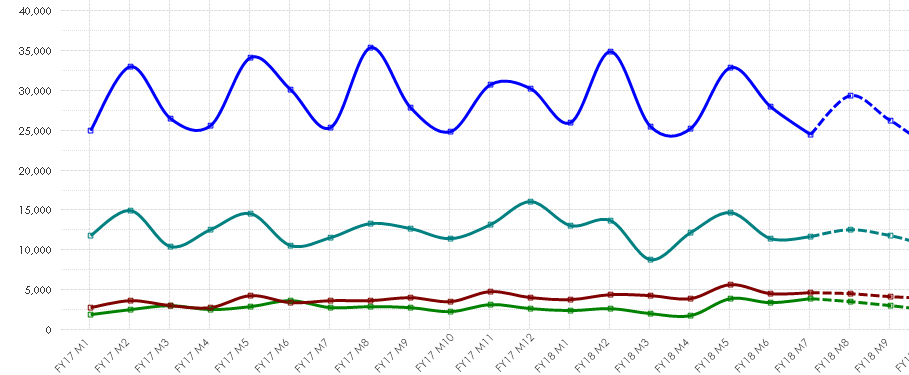
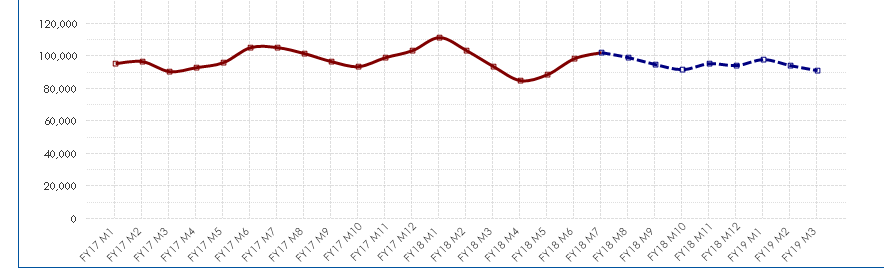
Objective : Running total by Month for all the years starting from 2008 to 2017 and draw line graph of this cumulative movement (ideally increasing line should be displayed).
Given: Year, Month and Amount
I am using below give formula:
rangesum(Above(Total sum(Paid),0,RowNo(Total)))
this formula is calculating running total by Year rather Months.
If I use :
rangesum(before(Total sum(Paid),0,ColumnNo(Total))),
nothing gets displayed.
I could't share graph or data due to security purpose. Could you please help?
My problem is similar to the one mentioned above by "qlikomni", can you please provide me qlikview file of above solution?
Thanks,
Akhil Sharma
+91 9599785096
- Mark as New
- Bookmark
- Subscribe
- Mute
- Subscribe to RSS Feed
- Permalink
- Report Inappropriate Content
My friend, I don't have a qlikview file...can you create a sample file and I can show you how to do this may be?
- Mark as New
- Bookmark
- Subscribe
- Mute
- Subscribe to RSS Feed
- Permalink
- Report Inappropriate Content
Hi,
I have created a sample excel file which has similar data that is I am using in qlikview file. I have also created a chart similar to the one I need to create in qlikview.
I have attached QV file as well where I am using below give formula:
rangesum(Above(Total sum(Paid),0,RowNo(Total)))
this formula is calculating running total by Year rather Months (refer Incorrect Cumulative graph).
If I use :
rangesum(before(Total sum(Paid),0,ColumnNo(Total))) (refer Modified Cumulative graph),
nothing gets displayed.
Please suggest what should I write.
Thanks,
Akhil Sharma
+91 9599785096
- Mark as New
- Bookmark
- Subscribe
- Mute
- Subscribe to RSS Feed
- Permalink
- Report Inappropriate Content
But where is the QlikView file that you created? how can I see the error?
- Mark as New
- Bookmark
- Subscribe
- Mute
- Subscribe to RSS Feed
- Permalink
- Report Inappropriate Content
I have modified my previous reply, please see qlikview file as well and suggest the correct expression to be written.
Actually correct graph should be like what is plotted in excel file.
If you look at qlikview graph (Incorrect cumulative graph), number is very much different from excel file graph. But excel file graph is correct and qlikview graph should be same to excel file.
Thanks,
Akhil Sharma
- Mark as New
- Bookmark
- Subscribe
- Mute
- Subscribe to RSS Feed
- Permalink
- Report Inappropriate Content
Try this expression
Aggr(RangeSum(Above(Sum(Salary), 0, RowNo())), Year, Month)
- Mark as New
- Bookmark
- Subscribe
- Mute
- Subscribe to RSS Feed
- Permalink
- Report Inappropriate Content
This is working fine as expected on small data with only limited columns (Year, Month, Salary) but when I added more columns then same formula is not giving expected result. I am not able to understand what is going wrong.
- Mark as New
- Bookmark
- Subscribe
- Mute
- Subscribe to RSS Feed
- Permalink
- Report Inappropriate Content
Add more columns? what columns are you adding?
- Mark as New
- Bookmark
- Subscribe
- Mute
- Subscribe to RSS Feed
- Permalink
- Report Inappropriate Content
Hey Sunny,
I was working on a similar issue where I had two dimensions.
While the Aggr(RangeSum(Above(Sum(Measure), 0, RowNo())), [dimension 1], [dimension 2]) was working, which I had been trying before I saw this post, it actually messed up the graph. I see that it worked for Vicio.
In my case what worked your was your first post on Aggr(Rangesum( Above(Sum(measure), 0, RowNo())), dimension 1, (dimension 2, (Numeric, Ascending)))
So thanks a lot ..... 
- Mark as New
- Bookmark
- Subscribe
- Mute
- Subscribe to RSS Feed
- Permalink
- Report Inappropriate Content
Hi Sunny,
I am trying to calculate the cumulative sum(3months) with two dimensions but not getting my line chart to work correctly. It works fine when there is only one dimension.
Chart working as expected:
Dimension-YearMonth
Expression-
Sum(Aggr(
rangesum(above(
if(type='Actuals',
Sum({<[Part type]={'Standard'},[Transaction type]={'Sales'},StdPartRegFlag={'Yes'},assigntest-={'SaaS'} >}Quantity),
if(type='Forecast',
Sum(Forecast),Sum(Forecast)
)
)
,0,3)),YearMonth
))
When I am adding another dimension to it (Product Hierarchy Level 2(It has 4 values)), the chart is getting messed up.
Dimension: YearMonth,Prod Hier Lvl 2
Expression:
Sum(Aggr(
rangesum(above(
if(type='Actuals',
Sum({<[Part type]={'Standard'},[Transaction type]={'Sales'},StdPartRegFlag={'Yes'},assigntest-={'SaaS'},[Product hierarchy lvl 6 desc]-={'None'}>}Quantity),
if(type='Forecast',
Sum({<[Product hierarchy lvl 6 desc]-={'None'}>}Forecast),Sum({<[Product hierarchy lvl 6 desc]-={'None'}>}Forecast)
))
,0,3)),YearMonth,[Prod Hier lvl 2]
))
Can you please help?