Unlock a world of possibilities! Login now and discover the exclusive benefits awaiting you.
- Qlik Community
- :
- Forums
- :
- Analytics
- :
- New to Qlik Analytics
- :
- Re: Sheet Navigation with Specific Chart (Auto Hid...
- Subscribe to RSS Feed
- Mark Topic as New
- Mark Topic as Read
- Float this Topic for Current User
- Bookmark
- Subscribe
- Mute
- Printer Friendly Page
- Mark as New
- Bookmark
- Subscribe
- Mute
- Subscribe to RSS Feed
- Permalink
- Report Inappropriate Content
Sheet Navigation with Specific Chart (Auto Hide and Show)
Hello World,
FYI I've attached sample application to test.
If you notice 2 sheets, there is one called Dashboard one more for Admin Page which should filter from there
So, If From Admin sheet once we hit Country (Either 1/2/3/4) which should navigate to First sheet and it will get suitable needed.
Use case - If Country1 select from Country Filter The dashboard should visible only Country1 Which means Remain all should be hide. Till here we are in good. The big challenge here is if we select Country3 from Admin page it should place in Country1 that means (Auto Place order in first place). So, that it should navigate to each like versa.
Note - There is Submit and Clear button in Admin sheet. This all effects only works when Button Clicked (that means dynamic)
Free to ask in case, Anything needed from my end. So, far My company Certify these extensions.
1) Sheet Navigation - Qlik Branch
2) Show Hide Container - Qlik Branch
Best,
Anil
- « Previous Replies
- Next Replies »
- Mark as New
- Bookmark
- Subscribe
- Mute
- Subscribe to RSS Feed
- Permalink
- Report Inappropriate Content
Wow... Seems works. Will test in my live app and get back to you.
AWESOME ... Let me know if you want anything else like pint bear 
- Mark as New
- Bookmark
- Subscribe
- Mute
- Subscribe to RSS Feed
- Permalink
- Report Inappropriate Content
For update prospective, I got it work for entire sheet
Drawbacks handy
1) I have 36 Viz's in single sheet. This is weird but forcibly i did due to i have not found alternative approach
2) It kills the performance (Because, 18 viz's are native and 18 viz's are Extensions - Yes, You may laugh {Because, Native getting late response compare to extension. Not even sure, Why this behavior running on floor})
3) Even though, We have demo tomorrow (For sure, Will let you know if my USER/Customer liked It !!!)
4) As i stated, Currently we have only 36 viz's for one source. In future, May be it cross 100 Viz's{for sure, It kills the performance - I have good system specifications [250 GB RAM - Good processor etc]}.
5) I may request, one more time if you have another approach (Digging)
- Mark as New
- Bookmark
- Subscribe
- Mute
- Subscribe to RSS Feed
- Permalink
- Report Inappropriate Content
Hard to comment on your performance issue not knowing your live data model & volumes, but 36 viz's is a lot and means it'll have 36 hypercubes to refresh on every select. If you've got 36 cores then that averages 1 hypercube per core. If you go up to 100 viz's then that averages nearly 3 hypercubes per core. and that certainly would have performance issues.
Maybe worthwhile looking at the performance monitor and see what happens when you do selections, especially CPU & RAM. I would guess you'll see all cores spiking to 100%. Beware, as if you are peaking out all your cores then all users on all dashboards will get a performance hit at the same time.
The simple suggestion is to not have so many viz's, but without knowing your dashboard I cannot know if that would be viable.
- Mark as New
- Bookmark
- Subscribe
- Mute
- Subscribe to RSS Feed
- Permalink
- Report Inappropriate Content
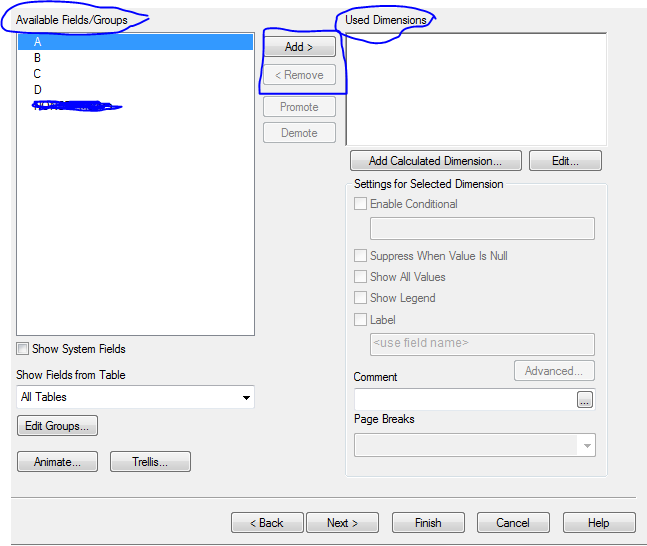
I am okay to reduce Viz's as we have bulk. And clubbing to each in single viz's (Earlier i don't have control). Now respect performance level looks okay. As i stated Initial stage i have commented submit button. So, Here If you look Image which i provide there are some values. Now, I am with that task which should be present like. Left side is for Countries and When i select something after "Add" it should be present in right side. Same functionality vice versa for "remove". If you have doubt, Will share some qvf in the evening time
- Mark as New
- Bookmark
- Subscribe
- Mute
- Subscribe to RSS Feed
- Permalink
- Report Inappropriate Content
Looks like your snip is from View as opposed to Sense, not sure I understand.
But you say you are ok to reduce number of viz's which sounds good.
- Mark as New
- Bookmark
- Subscribe
- Mute
- Subscribe to RSS Feed
- Permalink
- Report Inappropriate Content
That is default preview for Qlikview. The same functionality i am trying in sense for User Story (Fully, User understand). Finally, I did same Which looks good. Thanks for your contribution
- Mark as New
- Bookmark
- Subscribe
- Mute
- Subscribe to RSS Feed
- Permalink
- Report Inappropriate Content
Hello Sir, I am facing issue with 14 Charts? Do you have time to spend sometime with me?
If possible, Please share same version in QlikView - bill.markham
- Mark as New
- Bookmark
- Subscribe
- Mute
- Subscribe to RSS Feed
- Permalink
- Report Inappropriate Content
Update - I got in Qlikview as well It is working till 9 charts. Not more than.
Still, If you have time Can you work for 14 Metrics? I've tried using same concept But not working as expected in sense? Will you dispense something from your valuable time Bill Markham
Manish, For sure this is good practice if you can work mrkachhiaimp
- Mark as New
- Bookmark
- Subscribe
- Mute
- Subscribe to RSS Feed
- Permalink
- Report Inappropriate Content
For you, I spent some time because i don't want to waste your time. Here default should be Blank and then It should effect to each.. Can you work on this file?
- « Previous Replies
- Next Replies »