Unlock a world of possibilities! Login now and discover the exclusive benefits awaiting you.
- Qlik Community
- :
- All Forums
- :
- QlikView App Dev
- :
- Re: Using RangeSum and Aggr with 3 dimensions
- Subscribe to RSS Feed
- Mark Topic as New
- Mark Topic as Read
- Float this Topic for Current User
- Bookmark
- Subscribe
- Mute
- Printer Friendly Page
- Mark as New
- Bookmark
- Subscribe
- Mute
- Subscribe to RSS Feed
- Permalink
- Report Inappropriate Content
Using RangeSum and Aggr with 3 dimensions
Good evening all,
I'm hoping someone will be able to help resolve a conundrum I currently have....
I'm successfully using the below expression to calculate a daily value
sum(aggr(sum({< ReportingDate ={"<=$(=vMaxStockMovementDate)"}, labour_cost -={'0'}, transaction_type ={'COMP','DKIT','RWRK'} >} movement_quantity * usage_quantity*labour_cost),%WHComponent, %WHProduct, ReportingDate))
I'm now looking to apply a rolling average calculation to this using RangeSum and above where vRollingDays is a variable set by a slider (so the user can determine over how many days they want to average the data).
sum(aggr(RangeAvg(above(sum({<ReportingDate ={"<=$(=vMaxStockMovementDate)"}, labour_cost -={'0'}, transaction_type ={'COMP','DKIT','RWRK'} >} movement_quantity * usage_quantity * labour_cost),0,vRollingDays)),%WHComponent, %WHProduct, ReportingDate))
I can't get this to work, nor can I understand the output, however when I've used this structure before but with a single dimension in the aggr it works perfectly.
Any help would be greatly appreciated,
Thanks!
Accepted Solutions
- Mark as New
- Bookmark
- Subscribe
- Mute
- Subscribe to RSS Feed
- Permalink
- Report Inappropriate Content
I think it should rather look like:
RangeAvg(above(
sum(aggr(sum({< ReportingDate ={"<=$(=vMaxStockMovementDate)"}, labour_cost -={'0'}, transaction_type ={'COMP','DKIT','RWRK'} >} movement_quantity * usage_quantity*labour_cost),%WHComponent, %WHProduct, ReportingDate))
,0,$(vRollingDays)))
- Marcus
- Mark as New
- Bookmark
- Subscribe
- Mute
- Subscribe to RSS Feed
- Permalink
- Report Inappropriate Content
Thanks Marcus, that seems to have done the trick in terms of calculating correctly.
It has thrown out an additional issue....
the date field (ReportingDate) contains data for 5 days rather than 7 in a week (i.e. no data over a weekend), and now the average is taking the blank days.
For example....
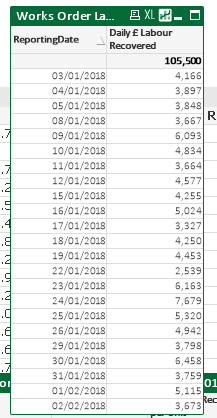
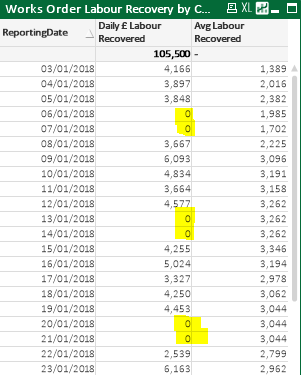
Is there anyway to remove this? I assume not as 'ReportingDate' comes from a calendar that includes all dates in the year, and the above calculation includes all dates, not just those with values?
Thanks,
Alex
- Mark as New
- Bookmark
- Subscribe
- Mute
- Subscribe to RSS Feed
- Permalink
- Report Inappropriate Content
It's not easy to say without deeper insights in your datamodel how it could be solved and which way would be the most elegant. Personally I use for such things a flag within the master-calendar which is 0 or 1 and which I could just aggregate with a sum-function to get the number of working days for the used selection. This could then be used in a logic like sum(value) / sum(workingdayFlag) to get the appropriate average.
Another way of using this flag is as condition within the set analysis, like:
... workingdayFlag = {1} ...
whereby in your case you might need this condition within the inner- and the outer-aggregation. This meant to apply it in this way:
...
sum({< workingdayFlag = {1} >} aggr(sum({< workingdayFlag = {1} ...
...
More to this could you find here: Set Analysis in the Aggr function.
- Marcus