Unlock a world of possibilities! Login now and discover the exclusive benefits awaiting you.
- Qlik Community
- :
- Forums
- :
- Analytics
- :
- App Development
- :
- Custom interval y-axis
- Subscribe to RSS Feed
- Mark Topic as New
- Mark Topic as Read
- Float this Topic for Current User
- Bookmark
- Subscribe
- Mute
- Printer Friendly Page
- Mark as New
- Bookmark
- Subscribe
- Mute
- Subscribe to RSS Feed
- Permalink
- Report Inappropriate Content
Custom interval y-axis
Hello,
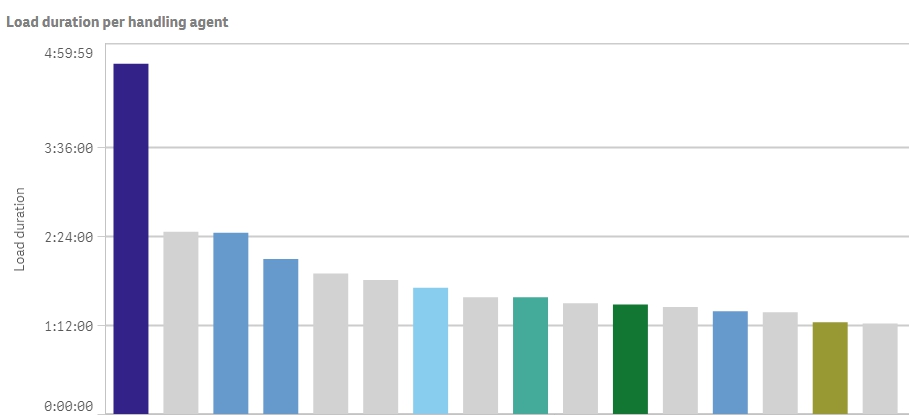
I have a bar chart in qlik sense with the average duration in hours on the y-axis. Is it possible to create a custom interval of 1 hour instead of 1:12 hour, so the gridlines appear on 1:00:00, 2:00:00, and so on. I have added a screenshot for clarification below:
Thanks in advance
- Mark as New
- Bookmark
- Subscribe
- Mute
- Subscribe to RSS Feed
- Permalink
- Report Inappropriate Content
Hi! You can set min and max from Appearance > Y-axis > Range > Custom, but setting intervals in between is not possible by default as far as I know.
- Mark as New
- Bookmark
- Subscribe
- Mute
- Subscribe to RSS Feed
- Permalink
- Report Inappropriate Content
Thanks for your reply. I have tried setting the min and max differently but this doesn't fix the interval. If this is not possible by default, is there maybe a bar chart extension which makes this possible?
- Mark as New
- Bookmark
- Subscribe
- Mute
- Subscribe to RSS Feed
- Permalink
- Report Inappropriate Content
Sorry, don't know about an extension with such a functionality. I see that Vizlib has a barchart coming soon, maybe this will be possible with their extension.