Unlock a world of possibilities! Login now and discover the exclusive benefits awaiting you.
- Qlik Community
- :
- All Forums
- :
- QlikView App Dev
- :
- Re: Accessing MiniChart Properties from Macro
- Subscribe to RSS Feed
- Mark Topic as New
- Mark Topic as Read
- Float this Topic for Current User
- Bookmark
- Subscribe
- Mute
- Printer Friendly Page
- Mark as New
- Bookmark
- Subscribe
- Mute
- Subscribe to RSS Feed
- Permalink
- Report Inappropriate Content
Accessing MiniChart Properties from Macro
I am working on an application that dynamically creates the necessary straight table, list box, etc. objects through a macro. In each of the straight tables, the first expression will be presented as a minichart. I have succeeded in representing the expression as a minichart, but am unable to then set the properties of the minichart object (such as mode, dimension, etc.) because I cannot figure out how to refer to the minichart object and therefore use the iminichartcellsettingsdef or iminichartlayoutdef classes available in the API Guide.
I have tried simply appending the minichart properties onto the expression I used to represent the expression as a minichart with no luck. I also tried sticking these properties directly on an object representing the expression, but alas.
The code I'm working with is below (simply for 2 straight tables to get working model). The part in bold blue is the what I'm trying to do (i.e. set the dimension and mode of the minichart) but can't figure out how to refer to the minichart object to access these properties. Any help is appreciated.
sub looper3
for i = 1 to 2
strval = ActiveDocument.Variables("dim_"&i).GetContent().string
set stb = ActiveDocument.Sheets("Main").CreateStraightTable
stb.AddDimension strval
stb.AddExpression "sum(Count)"
for j = 1 to 24
stb.AddExpression "=sum({$<Yearmonth={'=Rank(Yearmonth)="&j&"'}>} Count)"
next
stb_p = stb.GetProperties
xp = stb_p.Expressions.Item(0).Item(0).Data.ExpressionVisual
xp.Label.v = "Total"
xp.ImageRepresentation.Presentation = 7
xp.ImageRepresentation.Presentation.Dimension.Item(0).Name = "Yearmonth"
xp.ImageRepresentation.Presentation.Layout.GraphMode = "Sparkline"
stb.SetProperties xp
for k = 1 to 24
xp = stb_p.Expressions.Item(k).Item(0).Data.ExpressionVisual
xp.label.v = "=max({$<Yearmonth={'=Rank(Yearmonth)="&k&"'}>} Yearmonth)"
showxp = stb_p.Expressions.Item(k).Item(0).Data.ExpressionData
showxp.show.expression = "=if(isnull(max({$<Yearmonth={'=Rank(Yearmonth)="&k&"'}>} Yearmonth)) or tabular_hide = 1,0,1)"
showxp.show.type = 2
stb.SetProperties showxp
stb.SetProperties xp
next
next
end sub
- Mark as New
- Bookmark
- Subscribe
- Mute
- Subscribe to RSS Feed
- Permalink
- Report Inappropriate Content
Hi Thomas,
I found the below code in API guide. By default the minichart is set as Sparkline but I was not able find code for sparkline. I would suggest you to try below code and let us know whether you are able to create the desired chart.
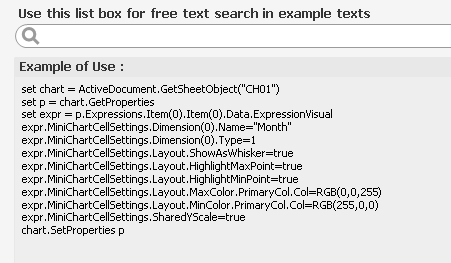
Note: I tried ShowasSparkline, showasSpark and some combinations and noting seems to be working.
- Mark as New
- Bookmark
- Subscribe
- Mute
- Subscribe to RSS Feed
- Permalink
- Report Inappropriate Content
Thanks for the reply, Tamil, but I am still unable to set the MiniChart properties. The code you provided above errors on the first line where '.MiniChartCellSettings' is envoked, giving 'Invalid procedure call or argument' as the error text (i.e. expr.MiniCharTCellSettings.Dimension(0).Name = "Month").
- Mark as New
- Bookmark
- Subscribe
- Mute
- Subscribe to RSS Feed
- Permalink
- Report Inappropriate Content
Hi Thomas,
Kindly check the below code and let us know if you still have any issues. Also, If possible, kindly attach some sample file for us to test.
sub looper3
for i = 1 to 2
strval = ActiveDocument.Variables("dim_"&i).GetContent().string
set stb = ActiveDocument.Sheets("Main").CreateStraightTable
stb.AddDimension strval
stb.AddExpression "sum(Count)"
for j = 1 to 24
stb.AddExpression "=sum({$<Yearmonth={'=Rank(Yearmonth)="&j&"'}>} Count)"
next
stb_p = stb.GetProperties
xp = stb_p.Expressions.Item(0).Item(0).Data.ExpressionVisual
xp.Label.v = "Total"
xp.ImageRepresentation.Presentation = 7
xp.MiniCharTCellSettings.Dimension(0).Name = "YearMonth"
stb.SetProperties xp
for k = 1 to 24
xp = stb_p.Expressions.Item(k).Item(0).Data.ExpressionVisual
xp.label.v = "=max({$<Yearmonth={'=Rank(Yearmonth)="&k&"'}>} Yearmonth)"
showxp = stb_p.Expressions.Item(k).Item(0).Data.ExpressionData
showxp.show.expression = "=if(isnull(max({$<Yearmonth={'=Rank(Yearmonth)="&k&"'}>} Yearmonth)) or tabular_hide = 1,0,1)"
showxp.show.type = 2
stb.SetProperties showxp
stb.SetProperties xp
next
next
end sub
- Mark as New
- Bookmark
- Subscribe
- Mute
- Subscribe to RSS Feed
- Permalink
- Report Inappropriate Content
Yes, I tried as you suggest. It still does not work, throwing an Invalid procedure call or argument error on the line 'xp.MiniChartCellSettings.Dimension(0).Name = "Yearmonth"' exactly as before. I've added a sample qvw. I commented out the line that causes the error in the macro. I also put what the desired results should be off to the side. Remove 'rem' tag in the macro editor and run to see error at above mentioned line. Thanks!
- Mark as New
- Bookmark
- Subscribe
- Mute
- Subscribe to RSS Feed
- Permalink
- Report Inappropriate Content
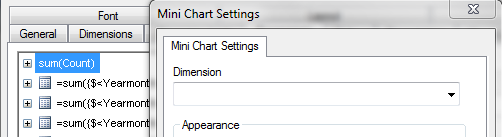
If we create a new chart and try to select the dimension name in the mini chart setting then it is not working. As you can see the dimension name is empty by default.
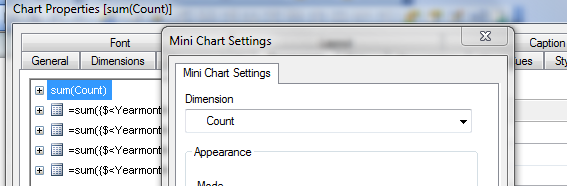
If we select any dimension name in the existing chart (Manually hard-coded the chart id and checked) then it's working fine (Dimension name changed to "YearMonth" through macro).
I am not sure about this behavior and I don't know how to make it working.
@ marcus_sommer Please advise.
- Mark as New
- Bookmark
- Subscribe
- Mute
- Subscribe to RSS Feed
- Permalink
- Report Inappropriate Content
I found 3 potential problems and this are the missing set assignments to the chart- and expression-properties and that the available dimension is named "Yearmonth" and not "YearMonth".
But the error remained and I believe that there is an error within the examples from the APIGuide and the statement is uncomplete or just wrong respectively it has a different meaning - if I look on the statement here: Add minichart column via VB macros it seemed that ...Name referred to an already existing dimension and maybe it's labeling but not to the creation of a dimension. I just tried a few other statements like Add.Dimension or dimension.item(0) and so on but nothing worked.
There is further the possibility that this feature isn't implemented within the vbs-side or that there is just a bug. I'm quite out of ideas ... maybe you could look within the xml-representation of such an object and this kind of expression (for example within the document-layout or per prj-folder) and find any hint how this feature may work. But it will be a quite ugly trial and error without a guarantee of any success ...
- Marcus
- Mark as New
- Bookmark
- Subscribe
- Mute
- Subscribe to RSS Feed
- Permalink
- Report Inappropriate Content
Tamil, thank you for continuing to review. I agree with your conclusion as indeed I am able to create the expression as a minichart (from the macro), but I cannot set the necessary properties to get it to display (i.e. dimension) from the macro. It seems like you found the same conclusion that Marcus pointed to on the other post, that we can control the minichart object from a Macro once it is created but cannot create it.
Marcus, thank you for reviewing as well, and good find on the other post showing that apparently we can control the object once it is created but seem to be unable to create it (at least create it with all necessary properties).
I would agree that this seems buggy. The only way I was able to set the expression as a minichart was by giving it .ImageRepresentation.Presentation = 7 which does not exist according to the APIGuide (it was a guess based on the match between the DDL in the GUI and the numbers listed in the API Guide).
"Presentation (short, read-write)
- Cell contents mode.
Cell contents mode
0 = Text
1 = Interpret value as image
2 = Info as image
3 = Circular gauge
4 = Linear gauge
5 = Traffic light gauge
6 = LED gauge"
Thanks for your help; I haven't ever accessed the xml of these objects, but I will try to poke around and see what I can find.
- Mark as New
- Bookmark
- Subscribe
- Mute
- Subscribe to RSS Feed
- Permalink
- Report Inappropriate Content
Hi Markus,
Thank you for the above suggestion. I agree with all your points. Even, I tried all the possibilities and ran out of guesses. So I have included you in this thread and expected some advise, as usual. Thanks.
Hi Thomas,
Glad that you have also tried to find the solution  . Kindly let us know if you find anything in the xml file.
Have a happy weekend!