Unlock a world of possibilities! Login now and discover the exclusive benefits awaiting you.
- Qlik Community
- :
- Forums
- :
- Analytics
- :
- App Development
- :
- Re: Running Total (YTD) split by dimension
- Subscribe to RSS Feed
- Mark Topic as New
- Mark Topic as Read
- Float this Topic for Current User
- Bookmark
- Subscribe
- Mute
- Printer Friendly Page
- Mark as New
- Bookmark
- Subscribe
- Mute
- Subscribe to RSS Feed
- Permalink
- Report Inappropriate Content
Running Total (YTD) split by dimension
Hi, I'm pretty new to Qlik Sense but I have a pretty solid background in the Power BI/DAX way of doing things. I realise there are some different paradigms which I need to rethink in Qlik but so far I'm really enjoying it.
As a learning project I'm trying to recreate an analysis I did in Power By which shows some headcount and attrition charts.
My source data looks like this:
| Name | Starting Date | Last Date | |
|---|---|---|---|
| Name1 | email1 | Date1 | Date2 (or null if still in place) |
| Name2 | email2 | Date3 | Date4 |
| etc |
Charts I'm trying to produce:
1. Monthly Adds vs Leavers - ok, I got this, I first unpivoted the Starting Date and Last Date so I can calculate one COUNT measure and then split the line chart by the Start/Last Dimension
2. Headcount total accumulation - got this also, I used a simple Rangesum(above(count) for Adds - Leaves
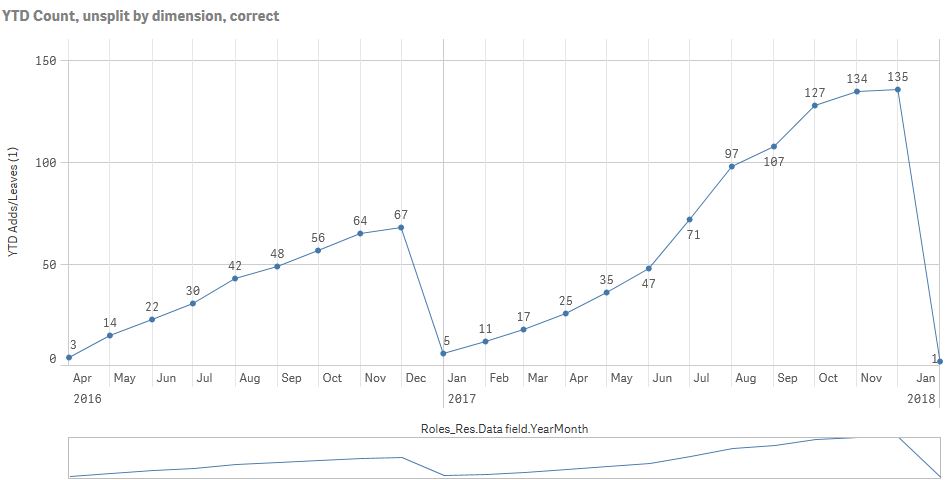
3. YTD (cumulative) Adds vs Leaves - so this one needs to reset every year start, not a total accumulation. Here's where it gets tricky for me:
Formula I used: Rangesum(above(count(Email),0,[Roles_Res.Data field.autoCalendar.Month]))
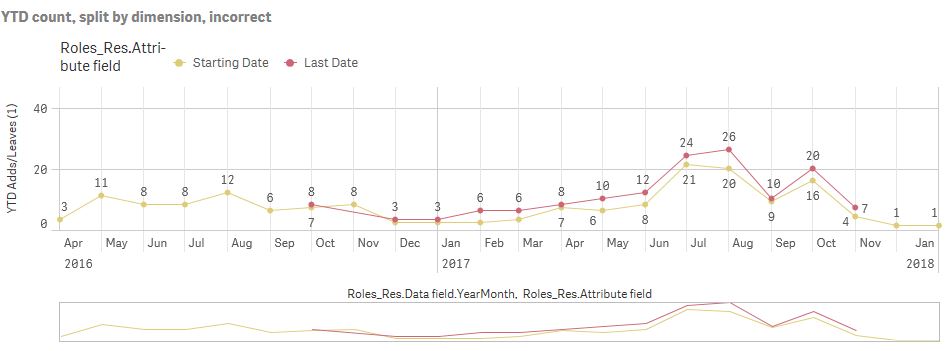
Everything works perfectly until I try to split it by the Start/Left dimension. I simply don't understand the results which this produces so I can try to track the root cause of the problem.
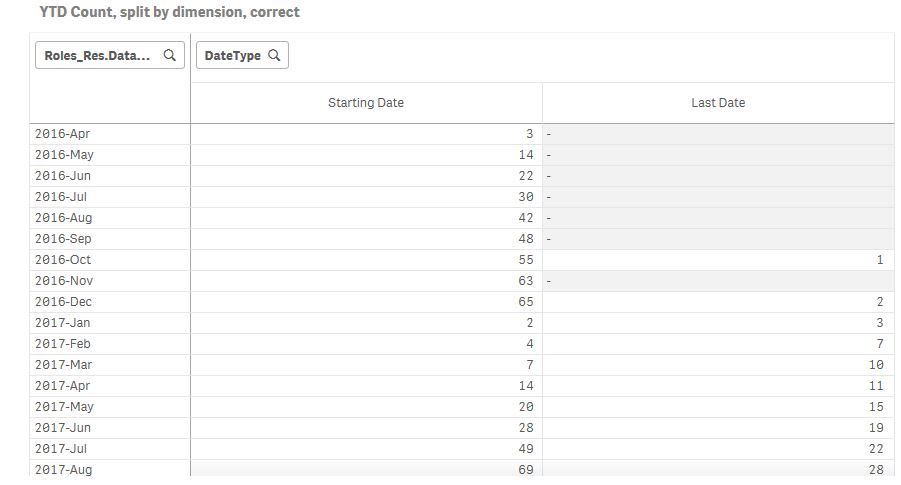
If I use the exact same dimensions and measure and do a Pivot Chart the data calculates correctly, as soon as I convert this to a Line chart the numbers are wrong.
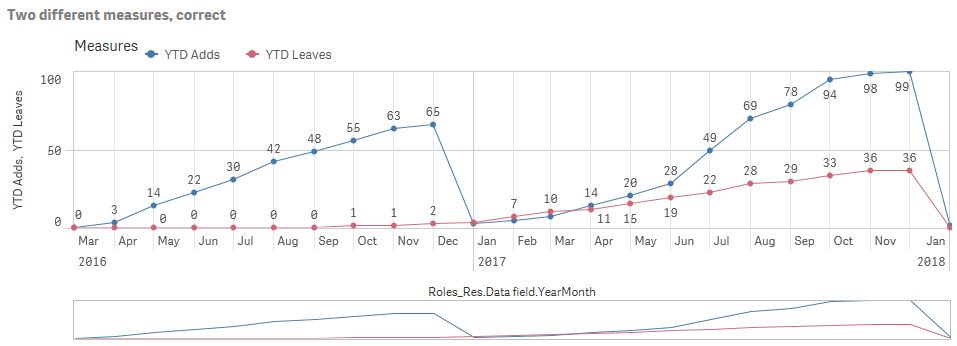
If I calculate two measures, one for Adds, one for Leavers, it also works correctly, and I suppose it could be a workaround, but I would really like to understand what's the problem with the initial approach.
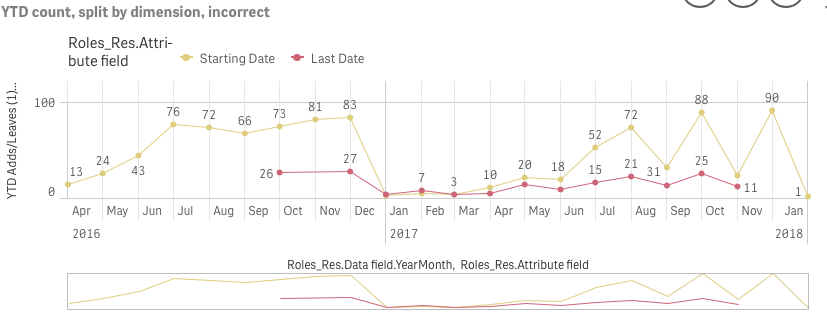
Some screenshots to exemplify the issue. Any ideas what I'm doing wrong?
- Tags:
- running total
Accepted Solutions
- Mark as New
- Bookmark
- Subscribe
- Mute
- Subscribe to RSS Feed
- Permalink
- Report Inappropriate Content
How about this
Aggr(RangeSum(Above(Count(Email), 0, [Roles_Res.Data field.autoCalendar.Month])), [Roles_Res.Attribute field], ([Roles_Res.Data field.YearMonth, (NUMERIC)))
- Mark as New
- Bookmark
- Subscribe
- Mute
- Subscribe to RSS Feed
- Permalink
- Report Inappropriate Content
Try this
Aggr(RangeSum(Above(Count(Email), 0, [Roles_Res.Data field.autoCalendar.Month])), [Roles_Res.Attribute field], [Roles_Res.Data field.YearMonth)
- Mark as New
- Bookmark
- Subscribe
- Mute
- Subscribe to RSS Feed
- Permalink
- Report Inappropriate Content
Thanks for checking this, still not correct I'm afraid. Here's what your formula produces (for reference, the correct numbers are in the Pivot above and in the 2 measures version)
Formula used here: Aggr(RangeSum(Above(Count(Email), 0, [Roles_Res.Data field.autoCalendar.Month])),[Roles_Res.Attribute field], [Roles_Res.Data field.autoCalendar.YearMonth])
- Mark as New
- Bookmark
- Subscribe
- Mute
- Subscribe to RSS Feed
- Permalink
- Report Inappropriate Content
How about this
Aggr(RangeSum(Above(Count(Email), 0, [Roles_Res.Data field.autoCalendar.Month])), [Roles_Res.Attribute field], ([Roles_Res.Data field.YearMonth, (NUMERIC)))
- Mark as New
- Bookmark
- Subscribe
- Mute
- Subscribe to RSS Feed
- Permalink
- Report Inappropriate Content
Yes!
Adding the NumericCount function did the trick.
Now, first of all why didn't my original formula work? All common sense tells me that the pivot numbers should've appeared correctly in the Line Chart...
Second, can you please explain in simple terms what the correct formula is doing?
Thanks!
- Mark as New
- Bookmark
- Subscribe
- Mute
- Subscribe to RSS Feed
- Permalink
- Report Inappropriate Content
Both your questions are linked to each other.... Your original expression didn't work because RangeSum(Above()) functions are sorting dependent. While you had the correct sorting of Attribute and then YearMonth ascending... the pivot table was YearMonth and then Attribute. This caused the output to differ. This again is a just a function of RangeSum(Above()) which accumulates based on your last dimension which in case of your line chart was Attribute and not Year Month.
By adding the Aggr() function we changed that by saying that first sort by Attribute and then YearMonth. This would have worked if you YearMonth was sorted in ascending order in the script. But since it didn't (and aggr, by default, sort by load order) you didn't get the right result.
Added the last piece to help Aggr() function sort by YearMonth in ascending order. You can read more about this feature here
The sortable Aggr function is finally here!
There was a more recent upgrade to this which you can read here
- Mark as New
- Bookmark
- Subscribe
- Mute
- Subscribe to RSS Feed
- Permalink
- Report Inappropriate Content
Very interesting, thanks a lot!