Unlock a world of possibilities! Login now and discover the exclusive benefits awaiting you.
- Qlik Community
- :
- Forums
- :
- Analytics
- :
- App Development
- :
- Re: Showing only this year and the previous of fou...
- Subscribe to RSS Feed
- Mark Topic as New
- Mark Topic as Read
- Float this Topic for Current User
- Bookmark
- Subscribe
- Mute
- Printer Friendly Page
- Mark as New
- Bookmark
- Subscribe
- Mute
- Subscribe to RSS Feed
- Permalink
- Report Inappropriate Content
Showing only this year and the previous of four years
Hi.
I have a bar chart like this:
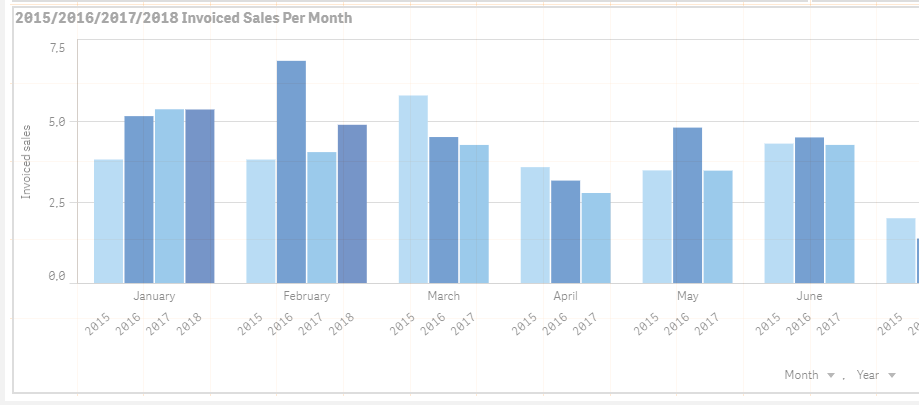
I want to display only this year and last.
Does anyone know the correct expression? Is it done in dimensions or measures?
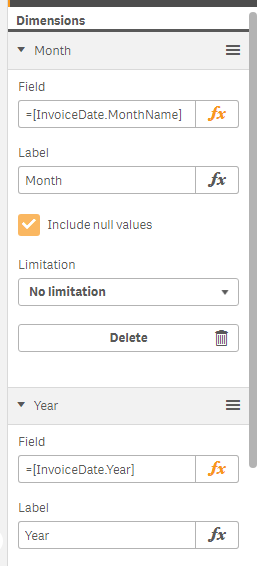
My dimensions look like this:
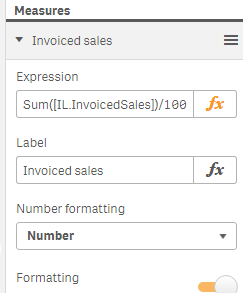
and measures like this:
But I suppose I need to make an expression in the Year dimension, right?
Hoping for the best 🙂
Accepted Solutions
- Mark as New
- Bookmark
- Subscribe
- Mute
- Subscribe to RSS Feed
- Permalink
- Report Inappropriate Content
Something like
sum({$<Year={">=$(=max(Year)-1)"}>} [IL.InvoicedSales])/100
should give you what you want.
- Mark as New
- Bookmark
- Subscribe
- Mute
- Subscribe to RSS Feed
- Permalink
- Report Inappropriate Content
Try this in expression. Change names as per your data
Sum( {$<Year = {2018,2017}>} Sales)
Thank you!
- Mark as New
- Bookmark
- Subscribe
- Mute
- Subscribe to RSS Feed
- Permalink
- Report Inappropriate Content
Something like
sum({$<Year={">=$(=max(Year)-1)"}>} [IL.InvoicedSales])/100
should give you what you want.
- Mark as New
- Bookmark
- Subscribe
- Mute
- Subscribe to RSS Feed
- Permalink
- Report Inappropriate Content
Great, thank you both Colin and Ishtdeep. Both give me what I want.
But now I have a follow-up question 🙂
The bars do not display for 2015/16, but the text for year does. Like this:
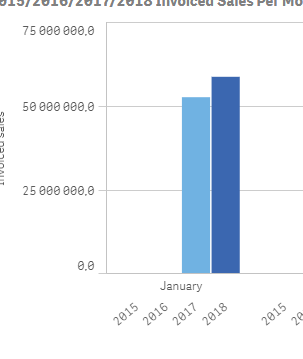
Does anyone know how I can remove the 2015/16 labels in this instance?
For all other reports in this series I use all years, it's just in this one instance I want to show less information.
/Rolf Erik
- Mark as New
- Bookmark
- Subscribe
- Mute
- Subscribe to RSS Feed
- Permalink
- Report Inappropriate Content
Have a look in the chart properties, under Data > Dimensions > Year. You probably have "Include null values" selected. Deselect that and the years with no values won't be displayed.
That should do it.
- Mark as New
- Bookmark
- Subscribe
- Mute
- Subscribe to RSS Feed
- Permalink
- Report Inappropriate Content
Thanks for the reply 🙂
But darn it, it didn't do it.
Is it in some way connected to the expression I use, perhaps?
It looks like this: sum({$<[InvoiceDate.Year]={">=$(=max([InvoiceDate.Year])-1)"}>} [IL.InvoicedSales])/1000000
Also I have both (of course) year and month as dimensions, and quarter as an alternative dimension.
Thoughts?
- Mark as New
- Bookmark
- Subscribe
- Mute
- Subscribe to RSS Feed
- Permalink
- Report Inappropriate Content
Does there perhaps need to be an expression i dimensions as well as measures?
- Mark as New
- Bookmark
- Subscribe
- Mute
- Subscribe to RSS Feed
- Permalink
- Report Inappropriate Content
I wouldn't think so, no. If you just have those dimensions added, with Include null values deselected on all of them, and just that one expression, then I would expect it to show only the values for the previous two years.
If you create a copy of the chart and convert it to a table that might give you a better idea of what is being shown.
Looking at your images again I see you have = and [ ] around your dimension names. You could try removing those.
If none of that works attach a sample and I'll see if I can see anything else.
- Mark as New
- Bookmark
- Subscribe
- Mute
- Subscribe to RSS Feed
- Permalink
- Report Inappropriate Content
Thanks for the reply 
I found the solution: By setting limitation to exact value in year greater than 0 and de-selecting the "show others", it worked out fine.
TGIF 😄
- Mark as New
- Bookmark
- Subscribe
- Mute
- Subscribe to RSS Feed
- Permalink
- Report Inappropriate Content
Glad you've got it working. One more thing I didn't mention was under Add-ons > Data handling, to untick "Include zero values". That might also have solved it. I wouldn't think you would need to set limitations, that might cause problems when the values change in the future.