Unlock a world of possibilities! Login now and discover the exclusive benefits awaiting you.
- Qlik Community
- :
- Forums
- :
- Analytics
- :
- App Development
- :
- Re: Export to excel total not matching with Qlik S...
- Subscribe to RSS Feed
- Mark Topic as New
- Mark Topic as Read
- Float this Topic for Current User
- Bookmark
- Subscribe
- Mute
- Printer Friendly Page
- Mark as New
- Bookmark
- Subscribe
- Mute
- Subscribe to RSS Feed
- Permalink
- Report Inappropriate Content
Export to excel total not matching with Qlik Straight table total
Hi team
I am having Straight Table as Chart
I am having a following as Dimention : Customer
measure:
if (vPeriod = 'YTD',
if (sum([Cost Price]) <> 0 ,
if (Sum([SP]) <> 0, num(sum([YTDSales]) - Sum([YTDFxSales]), '#,##0'), num(sum([YTDSales]), '#,##0')), 0),
)
Total in the Staright table is showing correct result.
but when i am trying to export this data and try to compare the total in excel and Total in Table is not matching .
What could b the reason .
Please provide your valuable comment as early as possible.
- Mark as New
- Bookmark
- Subscribe
- Mute
- Subscribe to RSS Feed
- Permalink
- Report Inappropriate Content
Hi ,
The problem i am seeing that could be due to "Total Mode ".
The total mode used was Auto and for testing when i make total mode as Sum the value are matching with excel .
But the problem is How to set Total mode for KPI and Subtitle in Bar Chart having same expression.
I think default it will be like "AUTO total mode".
Because the aim is Subtitle should have same value as exported data .
Please provide your comment.
- Mark as New
- Bookmark
- Subscribe
- Mute
- Subscribe to RSS Feed
- Permalink
- Report Inappropriate Content
Hi ,
The problem i am seeing that could be due to "Total Mode ".
The total mode used was Auto and for testing when i make total mode as Sum .
The value are matching with excel .
But the problem is How to set Total mode for KPI and Subtitle in Bar Chart using same expression.
I think default it will be like "AUTO total mode".
Because the aim is Subtitle should have same value as exported data
- Mark as New
- Bookmark
- Subscribe
- Mute
- Subscribe to RSS Feed
- Permalink
- Report Inappropriate Content
I'm not sure I can follow,
you should always set a total type for each measure, "sum of line", "total of expression".. you should see what is the value you're looking for and what is the correct combination depending on the dimensions you have.
- Mark as New
- Bookmark
- Subscribe
- Mute
- Subscribe to RSS Feed
- Permalink
- Report Inappropriate Content
How to set Total type for measure which we are using in subtitle of chart ?
- Mark as New
- Bookmark
- Subscribe
- Mute
- Subscribe to RSS Feed
- Permalink
- Report Inappropriate Content
Can you a screen shot of what you mean by this ? by subtitle of chart ?
- Mark as New
- Bookmark
- Subscribe
- Mute
- Subscribe to RSS Feed
- Permalink
- Report Inappropriate Content
This is might be data model issue. As chanty suggested aggr work for you.
but for that you have to apply aggr() on every expression written inside if()
like
num(if (vPeriod = 'YTD',
if (sum(aggr(sum([Cost Price]),Customer)) <> 0 ,
if (Sum(aggr(Sum([SP]),Customer)) <> 0, Sum(aggr(sum([YTDSales]),Customer)) - sum(aggr(Sum([YTDFxSales]),Customer)), sum(aggr(sum([YTDSales]),Customer)),0),
),'#,##0')
Note : correct if there is any bracket or syntax error.
Regards,
- Mark as New
- Bookmark
- Subscribe
- Mute
- Subscribe to RSS Feed
- Permalink
- Report Inappropriate Content
Hi Team ,
KPI : Total Sales variance Value : -0.12
In the Bar chart Subtitle Value is - -0.1199 (-0.12)
But expected value in Subtitle is : 1682177.64 which is (after exporting data to excel)
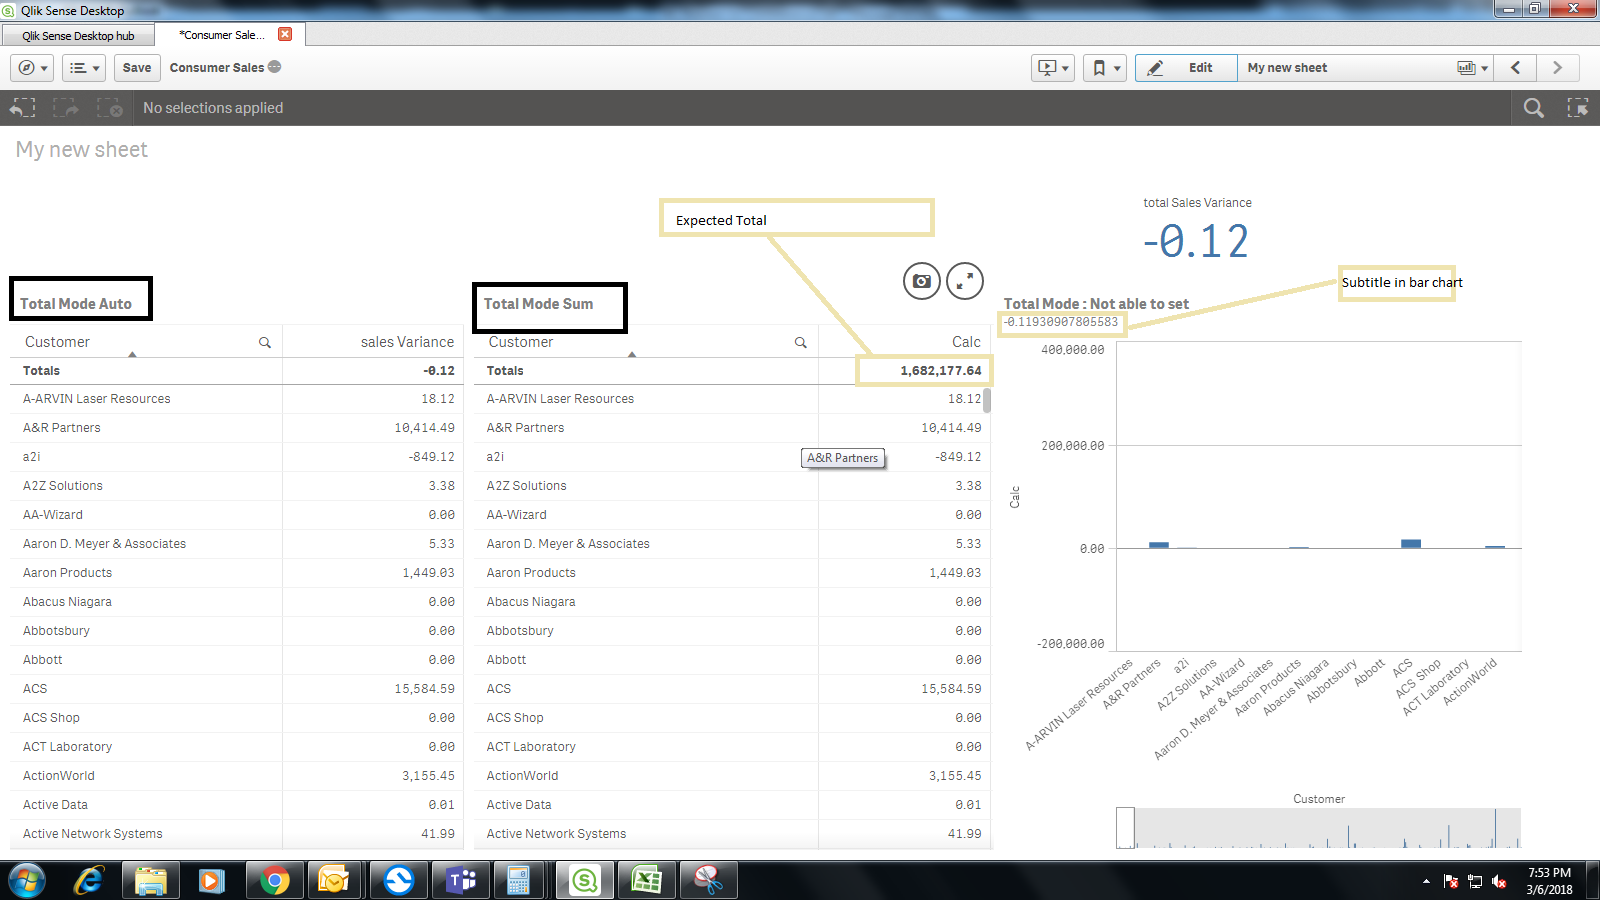
How to achive this ?
- Mark as New
- Bookmark
- Subscribe
- Mute
- Subscribe to RSS Feed
- Permalink
- Report Inappropriate Content
What do you have on the title expression ?
Under ASPECT => GENERAL
- Mark as New
- Bookmark
- Subscribe
- Mute
- Subscribe to RSS Feed
- Permalink
- Report Inappropriate Content
I have following expression in subtitle
=if((sum([YTD Sales Amount])-sum([LY YTD Sales Amount]))/sum([LY YTD Sales Amount])>-0.45,
(sum([YTD Sales Amount])-sum([LY YTD Sales Amount]))/sum([LY YTD Sales Amount]),sum([YTD Sales Amount]) )