Unlock a world of possibilities! Login now and discover the exclusive benefits awaiting you.
- Qlik Community
- :
- Forums
- :
- Analytics
- :
- App Development
- :
- Sum values of max date of period
- Subscribe to RSS Feed
- Mark Topic as New
- Mark Topic as Read
- Float this Topic for Current User
- Bookmark
- Subscribe
- Mute
- Printer Friendly Page
- Mark as New
- Bookmark
- Subscribe
- Mute
- Subscribe to RSS Feed
- Permalink
- Report Inappropriate Content
Sum values of max date of period
Hello,
I need to develop a measure in Qlik Sense that sums the product quantities of the last day of the period. Here goes some explanation of the measure and visualization:
- The period of visualization can change, it can be: Year, Month, Quarter, Week, Day ...
- The database has the information of quantity of products per day
Here goes some examples:
Database:
| Date (MM/DD/YY) | Product | Quantity |
| 01/01/18 | A | 10 |
| 01/01/18 | B | 20 |
| 01/01/18 | C | 30 |
| 01/15/18 | A | 5 |
| 01/15/18 | B | 50 |
| 01/15/18 | C | 100 |
| 01/15/18 | D | 80 |
| 02/01/18 | A | 5 |
| 02/01/18 | B | 15 |
| 02/01/18 | C | 20 |
| 02/08/18 | A | 15 |
| 02/08/18 | B | 30 |
| 02/08/18 | C | 30 |
| 02/08/18 | D | 50 |
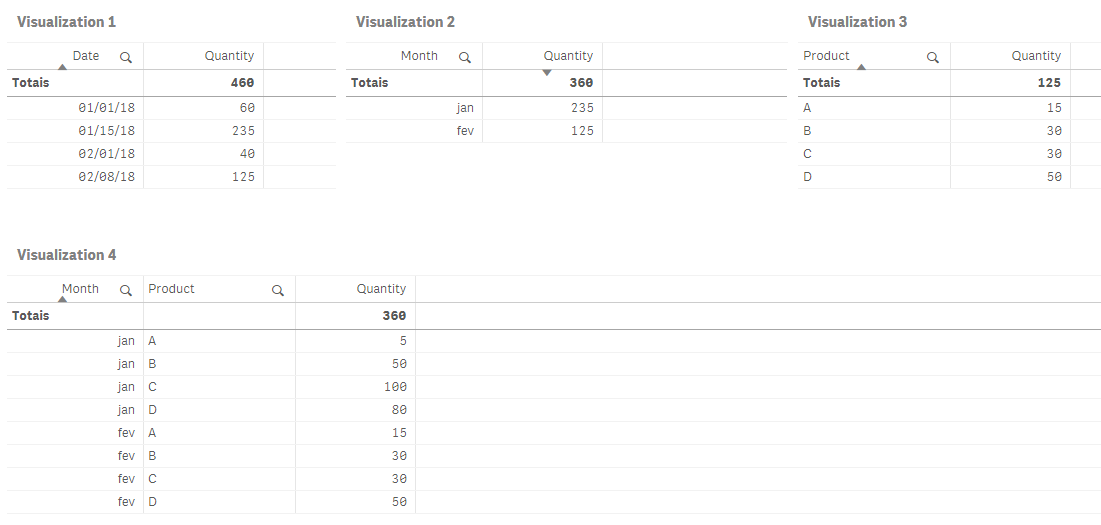
So lets see some visualizations that I would like:
Visualization 1:
| Date (MM/DD/YY) | Quantity |
| 01/01/18 | 60 |
| 01/15/18 | 235 |
| 02/01/18 | 55 |
| 02/08/18 | 110 |
Visualization 2:
| Month | Quantity |
| Jan | 235 |
| Feb | 110 |
Visualization 3: (This one uses the max date, in this case 02/08/2018)
| Product | Quantity |
| A | 0 |
| B | 30 |
| C | 30 |
| D | 50 |
Visualization 4:
| Month | Product | Quantity |
| Jan | A | 5 |
| Jan | B | 50 |
| Jan | C | 100 |
| Jan | D | 80 |
| Feb | A | 0 |
| Feb | B | 30 |
| Feb | C | 30 |
| Feb | D | 50 |
I think it is not a good idea to use AGGR, because the database is very big and there are more information about the products that can be put in the visualization. Can anyone help me?
Thanks in advance.
Daniel
- Tags:
- set analyses
- Mark as New
- Bookmark
- Subscribe
- Mute
- Subscribe to RSS Feed
- Permalink
- Report Inappropriate Content
What about this:
Farol BI
WhatsApp: 24 98152-1675
Skype: justen.thiago
- Mark as New
- Bookmark
- Subscribe
- Mute
- Subscribe to RSS Feed
- Permalink
- Report Inappropriate Content
Hi,
Create Year, Month,quarter, week ,day field in script based on date field
then
for 1:
dimension : Date
Expression : Sum(Quantity)
for 2:
dimension : Month
Expression : Sum(Quantity)
for 3:
dimension : product
Expression : Sum({<Date={"=$(=max(Date))"}>}Quantity)
for 4:
dimension : Month, Product
Expression : Sum(Quantity)
Regards,