Unlock a world of possibilities! Login now and discover the exclusive benefits awaiting you.
- Qlik Community
- :
- Forums
- :
- Analytics
- :
- New to Qlik Analytics
- :
- Re: moving average in a Pivot Table
- Subscribe to RSS Feed
- Mark Topic as New
- Mark Topic as Read
- Float this Topic for Current User
- Bookmark
- Subscribe
- Mute
- Printer Friendly Page
- Mark as New
- Bookmark
- Subscribe
- Mute
- Subscribe to RSS Feed
- Permalink
- Report Inappropriate Content
moving average in a Pivot Table
Hello all,
I have two separate tables that I load into Qlik Sense.
I then create a Pivot Table table as follows:
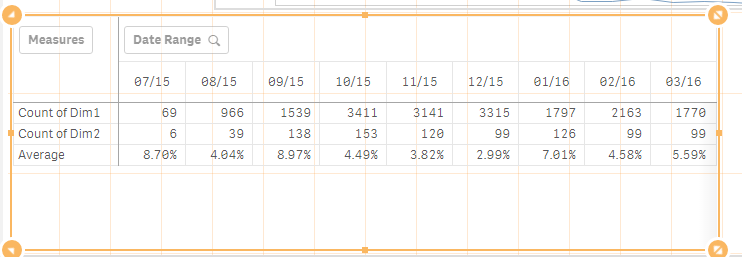
Dim1 is from Table1
Dim2 is from Table 2
Average is Count of Dim1/Count of Dim2
How do I:
1 - create a 3 month moving average based on the Average Values shown.
2 - can this then be put into a chart
Thank you,
Colin
- « Previous Replies
-
- 1
- 2
- Next Replies »
Accepted Solutions
- Mark as New
- Bookmark
- Subscribe
- Mute
- Subscribe to RSS Feed
- Permalink
- Report Inappropriate Content
Try this
=RangeSum(Before(Count(Dim2), 0, 3))/RangeSum(Before(Count(Dim1), 0, 3))

- Mark as New
- Bookmark
- Subscribe
- Mute
- Subscribe to RSS Feed
- Permalink
- Report Inappropriate Content
What would the numbers look like for 3 months moving average?
- Mark as New
- Bookmark
- Subscribe
- Mute
- Subscribe to RSS Feed
- Permalink
- Report Inappropriate Content
Hi Sunny,
It would be a percentage number as well.
Something along the lines of
Count ( {<previous 3 months>} Dim1) / Count ({<previous 3 months>} Dim2)
- Mark as New
- Bookmark
- Subscribe
- Mute
- Subscribe to RSS Feed
- Permalink
- Report Inappropriate Content
May be like this
RangeSum(Above(Count(Dim1), 0, RowNo()))/RangeSum(Above(Count(Dim2), 0, RowNo()))
- Mark as New
- Bookmark
- Subscribe
- Mute
- Subscribe to RSS Feed
- Permalink
- Report Inappropriate Content
Hi Sunny,
No that doesn't work.
if I try either part on its own I get a zero, namely:
RangeSum(Above(Count(Dim1), 0, RowNo()))
or
RangeSum(Above(Count(Dim2), 0, RowNo()))
So when I combine them, it is zero / zero.
- Mark as New
- Bookmark
- Subscribe
- Mute
- Subscribe to RSS Feed
- Permalink
- Report Inappropriate Content
Do I need to join the two tables together first?
Preferably I would prefer to avoid doing so.
- Mark as New
- Bookmark
- Subscribe
- Mute
- Subscribe to RSS Feed
- Permalink
- Report Inappropriate Content
Would you be able to share a sample?
- Mark as New
- Bookmark
- Subscribe
- Mute
- Subscribe to RSS Feed
- Permalink
- Report Inappropriate Content
Hi Sunny,
Yes, no problem.
Attached is an Excel file along with the QVF file in which I have associated the two tables.
I have made the data anonymous and just stripped it down to the bar bones for the purposes of this question.
Thanks,
Colin
- Mark as New
- Bookmark
- Subscribe
- Mute
- Subscribe to RSS Feed
- Permalink
- Report Inappropriate Content
Try this
=RangeSum(Before(Count(Dim2), 0, 3))/RangeSum(Before(Count(Dim1), 0, 3))
- Mark as New
- Bookmark
- Subscribe
- Mute
- Subscribe to RSS Feed
- Permalink
- Report Inappropriate Content
Hi Sunny,
You are legend.
That worked a treat for the Pivot Table.
The next step is to understand "how". I've gleaned the following from a quick search on the Community.:
before([ total ] expression [ , offset [,n ]])
Returns the value of expression evaluated with a pivot table's dimension values as they appear in the column before the current column within a row segment in the pivot table. This function returns NULL in all chart types except pivot tables. ]]
The full file is here under Functions.txt
Rangesum Above ,Below and Before,After and Range Avg
But that does mean it does not work for Charts.
How can I show it in a Chart please?
Thanks,
Colin
- « Previous Replies
-
- 1
- 2
- Next Replies »