Unlock a world of possibilities! Login now and discover the exclusive benefits awaiting you.
- Qlik Community
- :
- Forums
- :
- Analytics
- :
- New to Qlik Analytics
- :
- Re: 100% barchart
- Subscribe to RSS Feed
- Mark Topic as New
- Mark Topic as Read
- Float this Topic for Current User
- Bookmark
- Subscribe
- Mute
- Printer Friendly Page
- Mark as New
- Bookmark
- Subscribe
- Mute
- Subscribe to RSS Feed
- Permalink
- Report Inappropriate Content
100% barchart
Hello community,
I would like to make a 100% stacked bar chart.
Can someone help me with this?
now I get this.
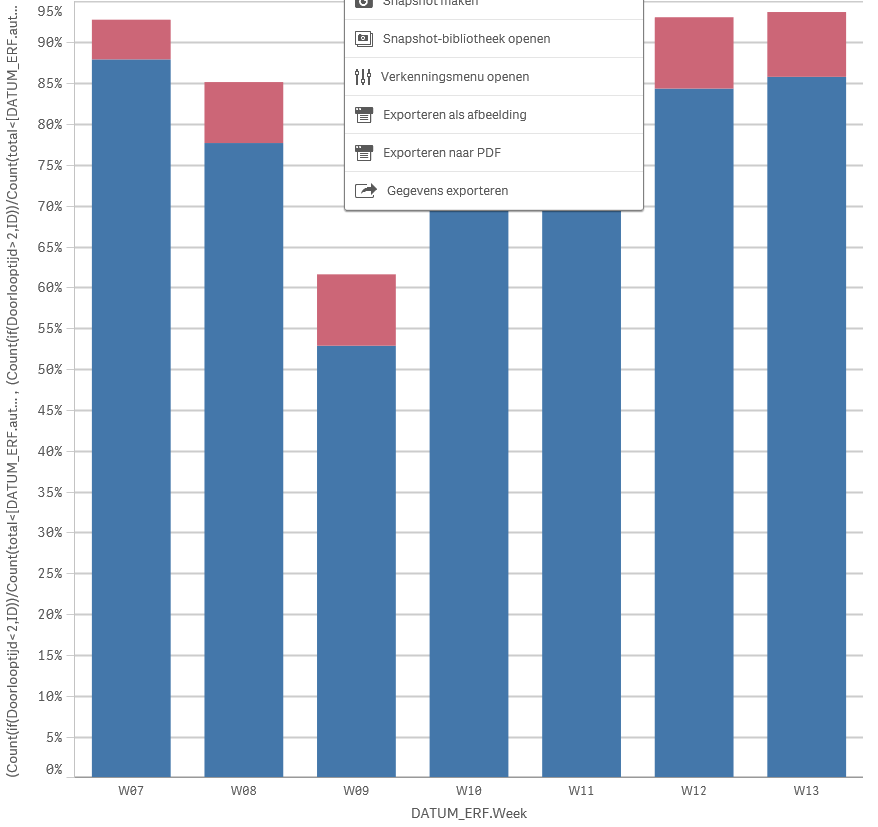
I use 1 dimension and 2 measure.
(Count(if(Doorlooptijd<2,ID))/Count(ID))
(Count(if(Doorlooptijd>2,ID))/Count(ID))
Thanks
Accepted Solutions
- Mark as New
- Bookmark
- Subscribe
- Mute
- Subscribe to RSS Feed
- Permalink
- Report Inappropriate Content
Hi,
Try this to ensure that the TOTAL still takes into account the dimension:
(Count(if(Doorlooptijd<2,ID))/Count(TOTAL <DATUM_ERF.Week> if(Doorlooptijd<>2,ID))
(Count(if(Doorlooptijd>2,ID))/Count(TOTAL <DATUM_ERF.Week> if(Doorlooptijd<>2,ID))
If it's still off, can you provide a qvw with the data so we can tinker with it? It's hard to find what goes wrong without seeing the background data.
- Mark as New
- Bookmark
- Subscribe
- Mute
- Subscribe to RSS Feed
- Permalink
- Report Inappropriate Content
Hi,
You have to have each value represent the percentage of the total for the week in order to make it work properly.
(Count(if(Doorlooptijd<2,ID))/Count(TOTAL ID))
(Count(if(Doorlooptijd>2,ID))/Count(TOTAL ID))
The below would get you closer to your goal, however you are missing the instance in which Doorlooptijd = 2. Should one of your if-statements include that?
Otherwise you need to use
(Count(if(Doorlooptijd<2,ID))/Count(TOTAL if(Doorlooptijd<>2,ID))
(Count(if(Doorlooptijd>2,ID))/Count(TOTAL f(Doorlooptijd<>2,ID))
- Mark as New
- Bookmark
- Subscribe
- Mute
- Subscribe to RSS Feed
- Permalink
- Report Inappropriate Content
Hi Niclas,
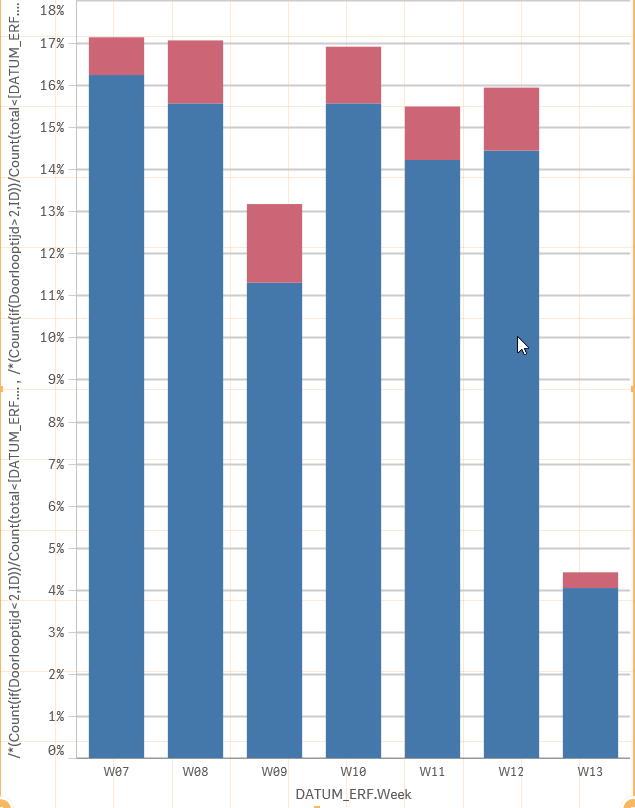
Thx but these formulas returns me this chart.
- Mark as New
- Bookmark
- Subscribe
- Mute
- Subscribe to RSS Feed
- Permalink
- Report Inappropriate Content
Hi,
Try this to ensure that the TOTAL still takes into account the dimension:
(Count(if(Doorlooptijd<2,ID))/Count(TOTAL <DATUM_ERF.Week> if(Doorlooptijd<>2,ID))
(Count(if(Doorlooptijd>2,ID))/Count(TOTAL <DATUM_ERF.Week> if(Doorlooptijd<>2,ID))
If it's still off, can you provide a qvw with the data so we can tinker with it? It's hard to find what goes wrong without seeing the background data.
- Mark as New
- Bookmark
- Subscribe
- Mute
- Subscribe to RSS Feed
- Permalink
- Report Inappropriate Content
Thx
It worked