Unlock a world of possibilities! Login now and discover the exclusive benefits awaiting you.
- Qlik Community
- :
- Forums
- :
- Analytics
- :
- New to Qlik Analytics
- :
- Re: Values Show in Chart as per Given Range with R...
- Subscribe to RSS Feed
- Mark Topic as New
- Mark Topic as Read
- Float this Topic for Current User
- Bookmark
- Subscribe
- Mute
- Printer Friendly Page
- Mark as New
- Bookmark
- Subscribe
- Mute
- Subscribe to RSS Feed
- Permalink
- Report Inappropriate Content
Values Show in Chart as per Given Range with RGB on Click of Button
Hi,
As I am working on Qliksense for One of the Insurance Company.
My Client Requirement is on the selection of Button Value should show as per range in Charts on Click of Button.
For eg: My Limit for Expression Value is <=60,so Chart has Expression Value <60 only Show in RED Color on Click of RED Button and Other Values Should Hide.
My Limit for Expression Value is >60<=80,so Chart has Expression Value >60<=80 only Show in GREEN Color on Click of GREEN Button Other Values Should Hide.
My Limit for Expression Value is >81,so Chart has Expression Value >81 only Show in AMBER Color on Click of AMBER Button Other Values Should Hide.
- Mark as New
- Bookmark
- Subscribe
- Mute
- Subscribe to RSS Feed
- Permalink
- Report Inappropriate Content
Hi Dhaval, I think the easiest way is creating a variable to control wich button has been pressed, each one sets the variable to one value (1,2,3). There are extensions to set variable values with buttons, ie:
http://branch.qlik.com/?_ga=1.210588061.985162163.1474569887#!/project/56728f52d1e497241ae697f8
Expression for button 1 variable can be: If($(VariableName)=1, 4, 1) // 4 to show all values
And different expressions with Pick():
Pick($(VariableName)
, Expression1 // red
, Expression2 // green
, Expression3 // amber
, Expression4 // all
)
- Mark as New
- Bookmark
- Subscribe
- Mute
- Subscribe to RSS Feed
- Permalink
- Report Inappropriate Content
This can be done without an extension although the buttons might not behave perfectly like normal buttons - try it out and see if it works for you:
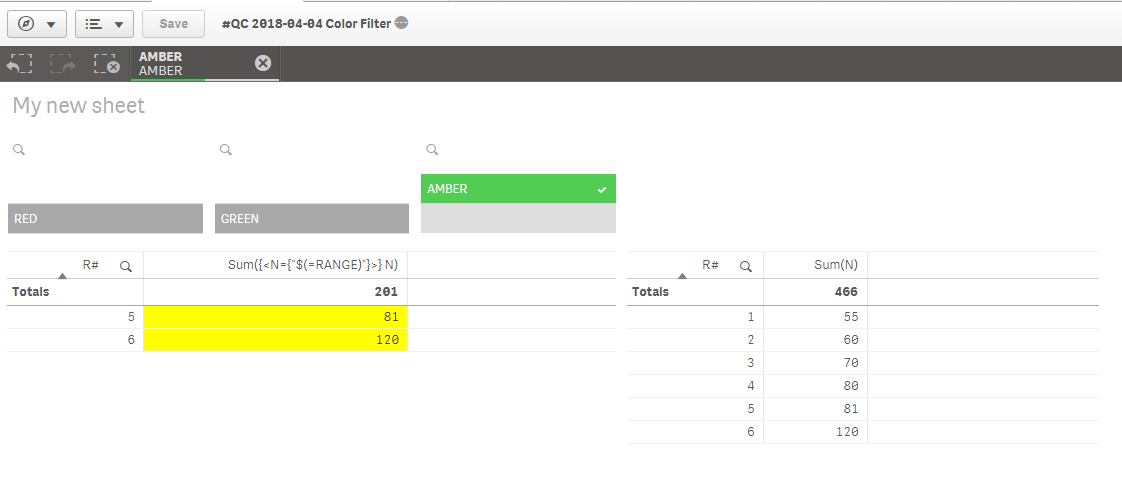
The selection boxes RED, GREEN and AMBER works with a single click actually. It would have been nice to get rid of the looking glass and avoid getting the X and V up when clicking - there is no need to press either of them....
- Mark as New
- Bookmark
- Subscribe
- Mute
- Subscribe to RSS Feed
- Permalink
- Report Inappropriate Content
I will prefer a mix of a variable extension that sets the range value using your expression, maybe with all set analysis in variable value to allow show all records.
But I take note of the idea, I really liked it.
- Mark as New
- Bookmark
- Subscribe
- Mute
- Subscribe to RSS Feed
- Permalink
- Report Inappropriate Content
Yes Ruben - I agree - it is not pretty - but if you have an environment where you can't use extensions this could be a "life saver".
- Mark as New
- Bookmark
- Subscribe
- Mute
- Subscribe to RSS Feed
- Permalink
- Report Inappropriate Content
Hi peter After Selecting on Red or Amber or Green it is showing Values..but I want that if I am not selecting any of Filter it should show all values and as on Filtering particular Red or Amber or Green It should show as per its Respective Range that what you have done...
Please Check and Kindly help me out Please..
Thanks in Advanced...
- Mark as New
- Bookmark
- Subscribe
- Mute
- Subscribe to RSS Feed
- Permalink
- Report Inappropriate Content
Hi Dhaval, based on Petter sample you can create the range values as N={"<=60"}.
And use as:
Sum({<$(=RANGE)>} N) // in expression and bg color expression
And remove the conditional calculation on add-ons tab to show when there are no values selected.
- Mark as New
- Bookmark
- Subscribe
- Mute
- Subscribe to RSS Feed
- Permalink
- Report Inappropriate Content
Hi,Petter
It shows values on Filtering RED,AMBER and GREEN..But without Filtering it should show all the values and after applying filters it should show respective values in which color range falls accordingly..??