Unlock a world of possibilities! Login now and discover the exclusive benefits awaiting you.
- Qlik Community
- :
- Forums
- :
- Analytics
- :
- New to Qlik Analytics
- :
- Re: Exclude negative values in pie chart - qliksen...
- Subscribe to RSS Feed
- Mark Topic as New
- Mark Topic as Read
- Float this Topic for Current User
- Bookmark
- Subscribe
- Mute
- Printer Friendly Page
- Mark as New
- Bookmark
- Subscribe
- Mute
- Subscribe to RSS Feed
- Permalink
- Report Inappropriate Content
Exclude negative values in pie chart - qliksense
How can I use a pie chart to show me the bottom 5 sub classes by excluding 0 and negative values.
Dimension is Subclass
Measure is sales
I used Rangemax(Sales,0) - not working
I used If(Sum([Sales]) > 0, Sum([Sales])) - not working
Any other advice? I am new to qliksense and all the help will be appreciated.
Thanks
- « Previous Replies
-
- 1
- 2
- Next Replies »
- Mark as New
- Bookmark
- Subscribe
- Mute
- Subscribe to RSS Feed
- Permalink
- Report Inappropriate Content
Hi Chanty
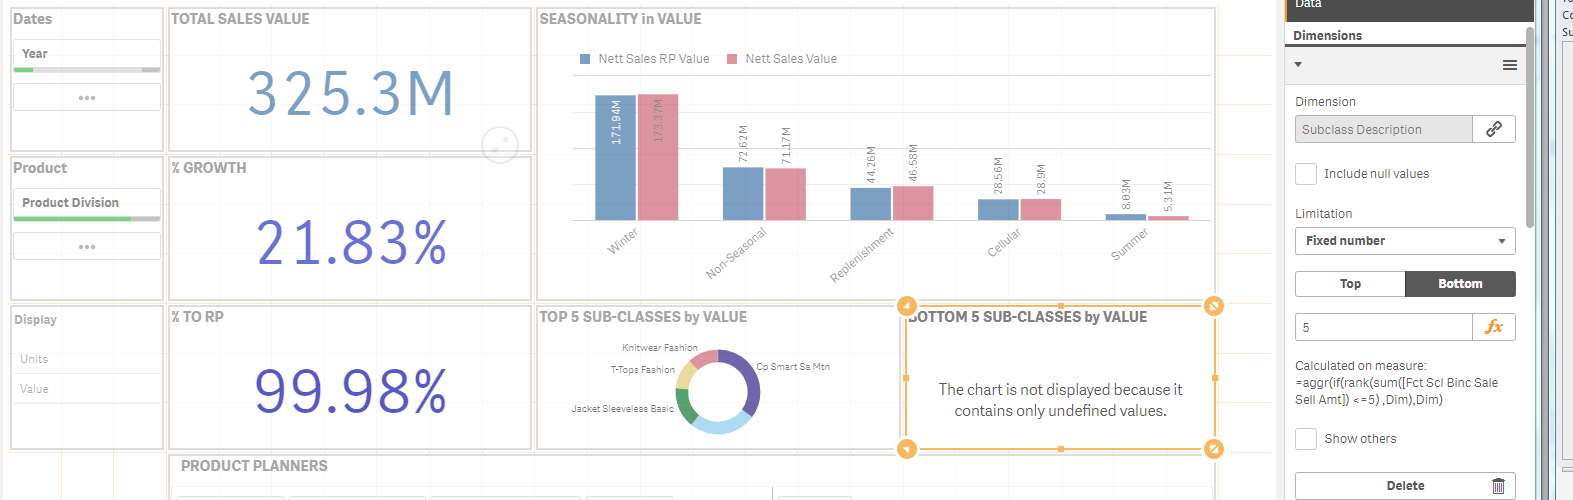
If you look on the right hand side you will see I set up my limitation and right at the bottom you will see the calculation expression =aggr(if(rank(sum([Fct Scl Binc Sale Sell Amt])
<=5) ,Dim),Dim)
which still yields the error of undefined values
- Mark as New
- Bookmark
- Subscribe
- Mute
- Subscribe to RSS Feed
- Permalink
- Report Inappropriate Content
Would you be able to share a sample to look at this issue?
- Mark as New
- Bookmark
- Subscribe
- Mute
- Subscribe to RSS Feed
- Permalink
- Report Inappropriate Content
can you add that columns into table and see what exctly values are?
- Mark as New
- Bookmark
- Subscribe
- Mute
- Subscribe to RSS Feed
- Permalink
- Report Inappropriate Content
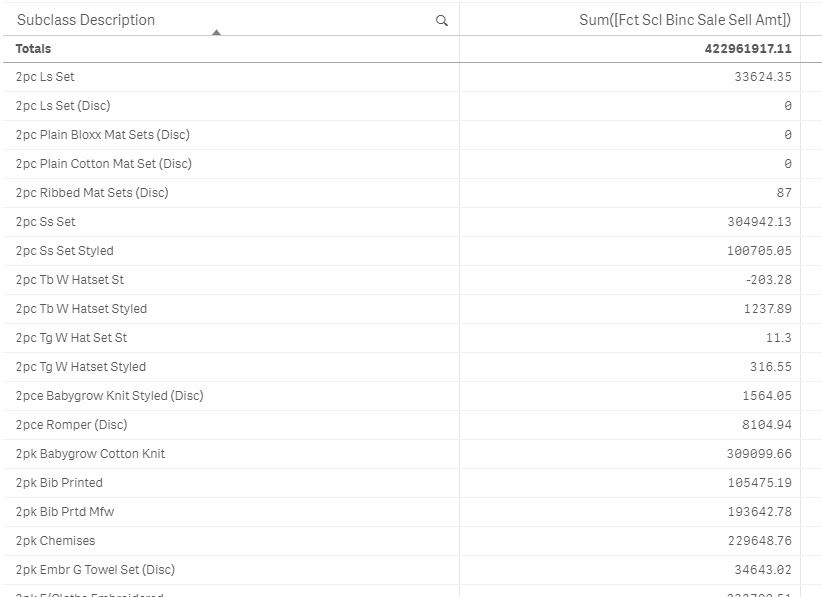
Hi Chanty
Columns attached below. So basically I want the pie chart to just read the positive numbers and exclude the negative and null values. Then with those positive numbers I want to set my limitation to the bottom 5.
- « Previous Replies
-
- 1
- 2
- Next Replies »