Unlock a world of possibilities! Login now and discover the exclusive benefits awaiting you.
- Qlik Community
- :
- Forums
- :
- Analytics
- :
- New to Qlik Analytics
- :
- Use of Dimension Limit on a Measure block the Alte...
- Subscribe to RSS Feed
- Mark Topic as New
- Mark Topic as Read
- Float this Topic for Current User
- Bookmark
- Subscribe
- Mute
- Printer Friendly Page
- Mark as New
- Bookmark
- Subscribe
- Mute
- Subscribe to RSS Feed
- Permalink
- Report Inappropriate Content
Use of Dimension Limit on a Measure block the Alter Measure
In a Bar Chart
1) If I have a Limitation on my Dimension the uses the Measurement , for example
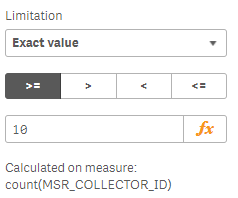
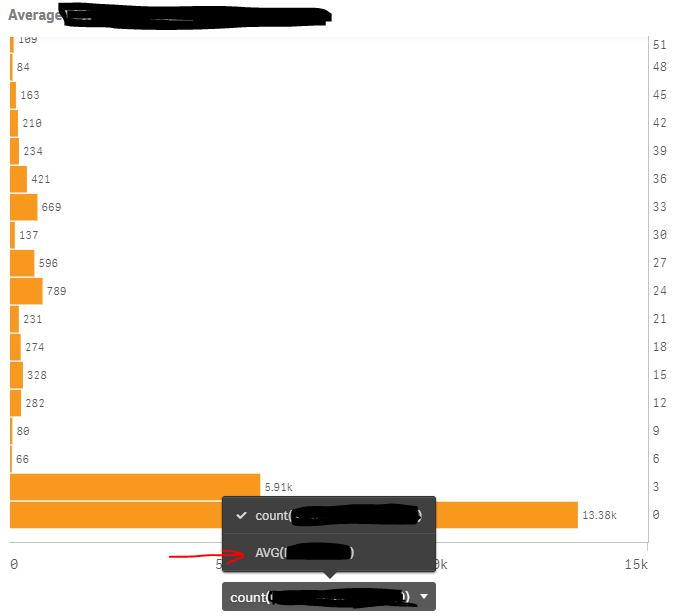
When the Use select the Alternate Measurement, the Limitation take place now on these other values with other range of validity and breaks the visualization:
 Ok !!!
Change to Alternative value... that has a different valid range
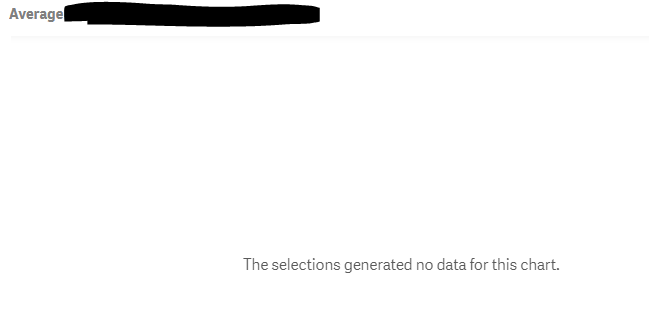
I believe that the Limitation is processed on this alternative measure. So the Limitation changes dynamically its effect using the displayed measurements and not the principal measurement presented at the configuration.
2) Also weird, when we go back to the edition, the editor propose to flip the principal measurement with the alternative. This is strange.
What we would expect: the last Dimension should be limited on a selected Measurement and only act on this selected Measurement, principal or alternative.