Unlock a world of possibilities! Login now and discover the exclusive benefits awaiting you.
- Qlik Community
- :
- Forums
- :
- Analytics
- :
- New to Qlik Analytics
- :
- Re: How to color chart by measures. (2 measures)
- Subscribe to RSS Feed
- Mark Topic as New
- Mark Topic as Read
- Float this Topic for Current User
- Bookmark
- Subscribe
- Mute
- Printer Friendly Page
- Mark as New
- Bookmark
- Subscribe
- Mute
- Subscribe to RSS Feed
- Permalink
- Report Inappropriate Content
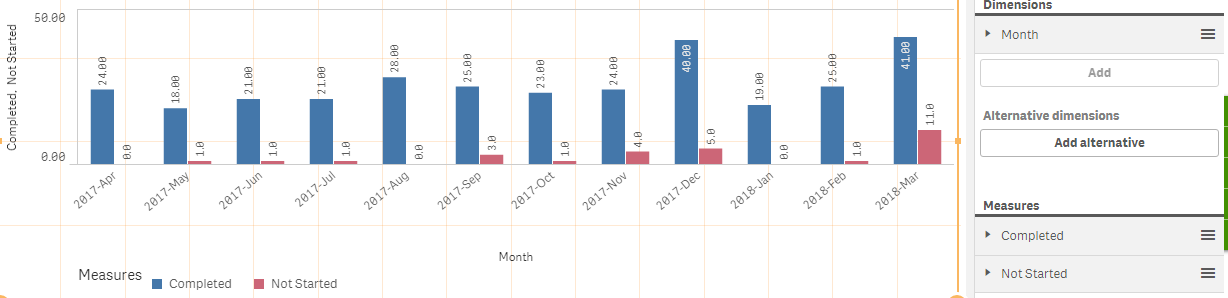
How to color chart by measures. (2 measures)
Dear Team,
Please help me. I have two measures & one dimension.
I want to color completed as green and not started as red.
Thanks.
- Mark as New
- Bookmark
- Subscribe
- Mute
- Subscribe to RSS Feed
- Permalink
- Report Inappropriate Content
HI ahamd albab,
create master measure for each measure and set color for each master measure and darg master measure to chart.
- Mark as New
- Bookmark
- Subscribe
- Mute
- Subscribe to RSS Feed
- Permalink
- Report Inappropriate Content
Hİ Ahmad,
if you add Completed/NotStarted parameter as a second dimension, you may change the color of the Completed/NotStared parameters like below;
if(Dimension='Completed', green(),
if(Dimension='NotStared',red()))
Add above code to the color by expression tab. you may also use rgb code instead of green()/red() function.
regards;
OY
- Mark as New
- Bookmark
- Subscribe
- Mute
- Subscribe to RSS Feed
- Permalink
- Report Inappropriate Content
Hello:
In this case, I use the expresion to calculate the color, for example:
if(COMPLETED_EXPRESSION>0, GREEN(), RED())
It's necesary that the expressions are complementary.
Best Regards.