Unlock a world of possibilities! Login now and discover the exclusive benefits awaiting you.
- Qlik Community
- :
- All Forums
- :
- QlikView App Dev
- :
- Re: How to compare between these 2 dimensions for ...
- Subscribe to RSS Feed
- Mark Topic as New
- Mark Topic as Read
- Float this Topic for Current User
- Bookmark
- Subscribe
- Mute
- Printer Friendly Page
- Mark as New
- Bookmark
- Subscribe
- Mute
- Subscribe to RSS Feed
- Permalink
- Report Inappropriate Content
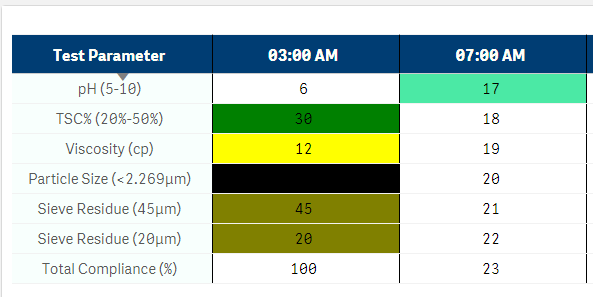
How to compare between these 2 dimensions for row 1 only?
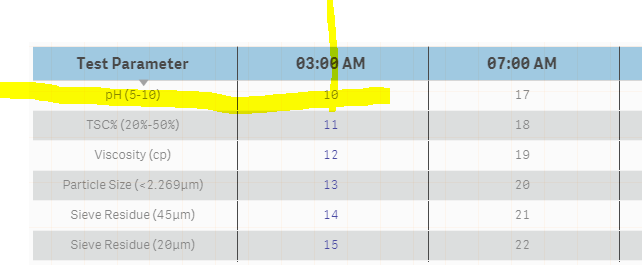
is there any solution on this? as u can see from the picture, i need to change the color of 10 to any colour that i want. but ist ispossible to query the Test parameter ph(5-10) and 03:00AM 10 only? thank you
- Tags:
- compare data
- « Previous Replies
-
- 1
- 2
- Next Replies »
- Mark as New
- Bookmark
- Subscribe
- Mute
- Subscribe to RSS Feed
- Permalink
- Report Inappropriate Content
If([TestParameter]='pH(5-10)' AND [03:00 AM]=10, YELLOW())
- Mark as New
- Bookmark
- Subscribe
- Mute
- Subscribe to RSS Feed
- Permalink
- Report Inappropriate Content
=IF(IF([Test Parameter] like 'pH (5-10)',
IF([03:00AM]>=6,
IF([03:00AM]<=10,GREEN(),BLUE()))),
IF([Test Parameter] like 'TSC% (20%-50%)',
IF([03:00AM]>=20,
IF([03:00AM]<=50,GREEN(),BLUE()))))
can you help me on this? this query does not effect my table. i want to do it for all test parameter. kindly appreciate your answer before.
- Mark as New
- Bookmark
- Subscribe
- Mute
- Subscribe to RSS Feed
- Permalink
- Report Inappropriate Content
Muhammad, you use 'cross table' for presentation. So, the answer, IMHO, will be at the side 'operations with CrossTables'. Do you want to try to solve it yourself with only lightweight advices? Or already only want the 'final answer'?
- Mark as New
- Bookmark
- Subscribe
- Mute
- Subscribe to RSS Feed
- Permalink
- Report Inappropriate Content
yeahh. i want the final answer if u may. thanks 
- Mark as New
- Bookmark
- Subscribe
- Mute
- Subscribe to RSS Feed
- Permalink
- Report Inappropriate Content
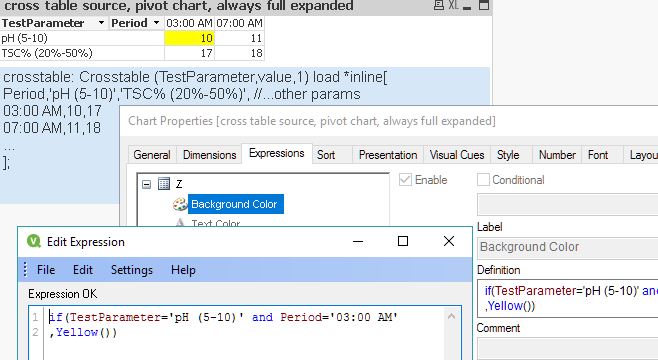
may be this way? it seems to be very traditional/classic for most of BI tools.
- Mark as New
- Bookmark
- Subscribe
- Mute
- Subscribe to RSS Feed
- Permalink
- Report Inappropriate Content
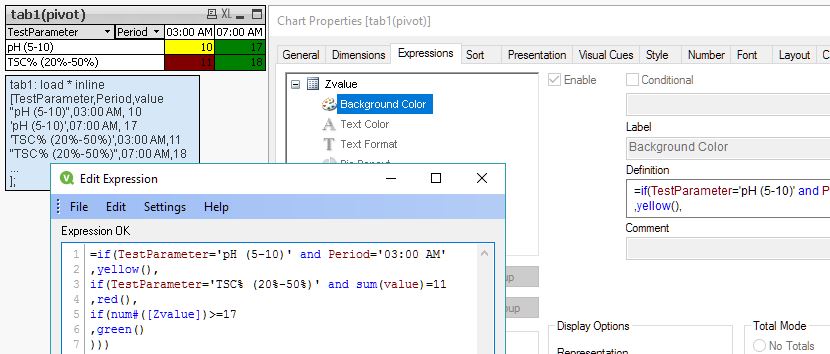
the way to use kilograms of parameters from a traditional cross-table used as a source:
p.s.

crosstable crosstables
- Mark as New
- Bookmark
- Subscribe
- Mute
- Subscribe to RSS Feed
- Permalink
- Report Inappropriate Content
thanks mr Игорь Степанов. but may i know this can happened in Qlik Sense?
- Mark as New
- Bookmark
- Subscribe
- Mute
- Subscribe to RSS Feed
- Permalink
- Report Inappropriate Content
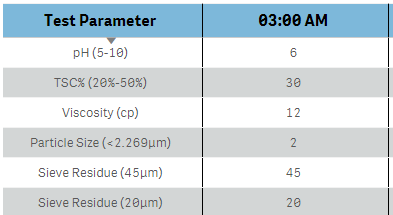
if([Test Parameter] like 'pH (5-10)' AND [03:00AM]>=5 AND [03:00AM]<10,BLUE(),
if([Test Parameter] like 'TSC% (20%-50%)' AND [03:00AM]>=20 AND [03:00AM]<51,GREEN(),
if([Test Parameter] like 'Viscosity (cp)' AND [03:00AM]>10 AND [03:00AM]<13,YELLOW(),
if([Test Parameter] like 'Particle Size (<2.269µm)' AND [03:00AM]>1 AND [03:00AM]<3,BLACK(),
if([Test Parameter] like 'Sieve Residue (45µm)' AND [03:00AM]>1 AND [03:00AM]<46,BROWN(),
if([Test Parameter] like 'Sieve Residue (20µm)' AND [03:00AM]>1 AND [03:00AM]<21,BROWN()))))))
as u can see in this query, the 1st row in 03:00AM should be BLUE but it became white. actually this table, i want to display the data that in range, if out of range, it change other colour. but it seems like impossible. correct me if im wrong. thanks
- Mark as New
- Bookmark
- Subscribe
- Mute
- Subscribe to RSS Feed
- Permalink
- Report Inappropriate Content
Muhammad,
I used soft that was currently under(in) my hand(comp), it was QV desktop. But it doesnt matter, it's just a Qlik family product. May be there are some manual differences, but not the model and pivot-table... I hope))
Regarding the 'painting')), it looks like you already have some results.
You can leave here the sample-file and we(forum users) can check it here later.
Regarding the model and instrument: I showed the 'cross-table model' as incremental source (my second attempt, see above both of them) and the usual pivot table as the instrument for presentation, where I just manually moved "Timeline"\"Periods" field to Header of a regular pivot table. I will check later the QS desktop later for this type of manual operations with regular pivot-tables... but probably it worked there too the same way.
BR, Igor)
- « Previous Replies
-
- 1
- 2
- Next Replies »