Unlock a world of possibilities! Login now and discover the exclusive benefits awaiting you.
- Qlik Community
- :
- All Forums
- :
- QlikView App Dev
- :
- Re: show just value of two last months in table or...
- Subscribe to RSS Feed
- Mark Topic as New
- Mark Topic as Read
- Float this Topic for Current User
- Bookmark
- Subscribe
- Mute
- Printer Friendly Page
- Mark as New
- Bookmark
- Subscribe
- Mute
- Subscribe to RSS Feed
- Permalink
- Report Inappropriate Content
show just value of two last months in table or chart
I want to create a table or chart and I have "Month" as dimension, and I want to limit this dimension only by showing the last "2 months+ current month", In this case, I would like to show the data for the months of Jan,Feb,March. and they separate in two other field that show the average usage and average subscribers.
something like following pic:
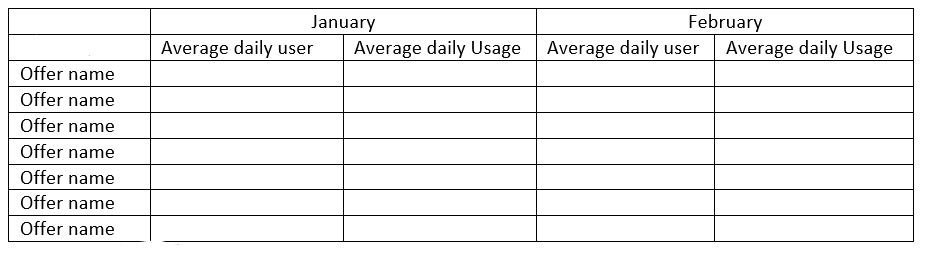
would you please help me , how can set condition for them to show just 2 last month and seprate them in 2part again.
- Mark as New
- Bookmark
- Subscribe
- Mute
- Subscribe to RSS Feed
- Permalink
- Report Inappropriate Content
Please post sample app or sample data
- Mark as New
- Bookmark
- Subscribe
- Mute
- Subscribe to RSS Feed
- Permalink
- Report Inappropriate Content
Hi Nazanin
there are a couple of options:
1: create a field in your calendar for last month and last last mont... or month -2 etc then filter your table based on these
2: set analysis - search for seta analysis with dates, lots has been written about this.
- Mark as New
- Bookmark
- Subscribe
- Mute
- Subscribe to RSS Feed
- Permalink
- Report Inappropriate Content
Dear Ron
thanks for ur response
for first solution do you mean to define a calendar in qlikview editor or using the data base calendar?
- Mark as New
- Bookmark
- Subscribe
- Mute
- Subscribe to RSS Feed
- Permalink
- Report Inappropriate Content
Dear Sasidhar
I just want to show the last two month and current month data in qlik view in table container chart.
but I couldn't.
what details do you want exactly? I will share with you
- Mark as New
- Bookmark
- Subscribe
- Mute
- Subscribe to RSS Feed
- Permalink
- Report Inappropriate Content
Hi Nazanin
Yes a QlikView calendar, the Qlik website has a number of people's calendars. I have one I picked up from someone on a forum. I can send it through this post if you like. But in the calendar you can calculate a flag for each date to be current month, previous month etc this makes the set analysis easier as you can just select for these flags rather than building the date logic within the set analysis. This can be done but if it's a date range you want to use frequently it makes sense to add it to the calendar.
Calendar flags can also be used as filter boxes.
There's a good blog post here as a starter if you want to use set analysis
https://community.qlik.com/blogs/qlikviewdesignblog/2015/09/28/dates-in-set-analysis