Unlock a world of possibilities! Login now and discover the exclusive benefits awaiting you.
- Qlik Community
- :
- Forums
- :
- Analytics
- :
- New to Qlik Analytics
- :
- Re: Custom Labels instead of Dimension in Bar char...
- Subscribe to RSS Feed
- Mark Topic as New
- Mark Topic as Read
- Float this Topic for Current User
- Bookmark
- Subscribe
- Mute
- Printer Friendly Page
- Mark as New
- Bookmark
- Subscribe
- Mute
- Subscribe to RSS Feed
- Permalink
- Report Inappropriate Content
Custom Labels instead of Dimension in Bar chart
Hi,
I have the following Dimension ValueList(1,2,3) and Formula ValueList(1,2,3).
I would like to present some other labels than the dimension context : e.g. ValueList('a','b', 'c')
However the Presentation Tab -> Legend is disabled and ther appears to be no additional field
- Mark as New
- Bookmark
- Subscribe
- Mute
- Subscribe to RSS Feed
- Permalink
- Report Inappropriate Content
If I understand your question I would simply apply the values that you want for this field in your load script. Then these values will display on your bar chart. This assumes that you want these values on all of your charts and not just this one.
- Mark as New
- Bookmark
- Subscribe
- Mute
- Subscribe to RSS Feed
- Permalink
- Report Inappropriate Content
I have several fields available For example
[Dimension]
[FormulaValues]
[DimensionLabels]
The Dimensions are unique, the Labels are not.
My problem is that I wish to display custom Labels for the dimensions.
- Mark as New
- Bookmark
- Subscribe
- Mute
- Subscribe to RSS Feed
- Permalink
- Report Inappropriate Content
Can you give me a real example of what your data looks like and what you want the chart to look like?
I am still not getting what you are trying to do.
- Mark as New
- Bookmark
- Subscribe
- Mute
- Subscribe to RSS Feed
- Permalink
- Report Inappropriate Content
Hey,
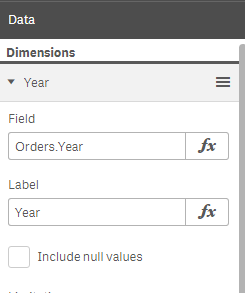
If I'm not wrong, you can try this.
- Mark as New
- Bookmark
- Subscribe
- Mute
- Subscribe to RSS Feed
- Permalink
- Report Inappropriate Content
Your suggestions appears to be directed towards qliksense
- Mark as New
- Bookmark
- Subscribe
- Mute
- Subscribe to RSS Feed
- Permalink
- Report Inappropriate Content
I would like the chart on the left but with arbitrary x-tick labes
- Mark as New
- Bookmark
- Subscribe
- Mute
- Subscribe to RSS Feed
- Permalink
- Report Inappropriate Content
Can you provide a solution to the problem in my app?
best regards
- Mark as New
- Bookmark
- Subscribe
- Mute
- Subscribe to RSS Feed
- Permalink
- Report Inappropriate Content
The only Solution I have found is to concat a unique number and hope that the number is small.
= uniqueID &'. '& nonuniqueLabel