Unlock a world of possibilities! Login now and discover the exclusive benefits awaiting you.
- Qlik Community
- :
- Forums
- :
- Analytics
- :
- App Development
- :
- Re: Different Expression Results When Using Dimens...
- Subscribe to RSS Feed
- Mark Topic as New
- Mark Topic as Read
- Float this Topic for Current User
- Bookmark
- Subscribe
- Mute
- Printer Friendly Page
- Mark as New
- Bookmark
- Subscribe
- Mute
- Subscribe to RSS Feed
- Permalink
- Report Inappropriate Content
Different Expression Results When Using Dimension Limits, Pick(), and Dimensionality()
I'm working on a Qlik Sense app for our HR department and one of the key measures that's needed is the Average Number of Employees over time. This measure has some value in and of itself but the more important metric that we are after is the "Turnover Ratio" which is defined as:
# of Terminations / Average Number of Employees (within time frame being analyzed)
In the 1st iteration of this application there were separate fields used based on which level of our organizational hierarchy/structure was being analyzed such as "Active Employee Count by Business Unit" and "Active Employee Count by Location". This has been working great but ultimately proved to be too rigid for a variety of reasons as well as requiring more maintenance than it should. We would like to be able to handle this with a single Variable/Master Item that can be used with a variety of chart dimensions but in order to avoid creating measures that are basically hard-wired to a specific dimension (such as "Turnover Ratio by Job Title" and "Turnover Ratio by Race & Ethnicity") we need to be able to pick our aggregation dimensions dynamically.
I have attempted to solve this using a combination of GetObjectField() and a Pick() function within my "Average Number of Employees" variable/master item but can't get it working properly. It should be noted that this chart is using a Fixed Number Dimension Limitation to limit the chart to the Top 10 <Dimension>'s with the highest Turnover Ratio's. In my examples below I'm focusing on the Average Number of Employees measure since if I can't get this number right I obviously can't expect my Turnover Ratio calculation to come out correct.
Expression Works When Used On Its Own:
Avg(Aggr(Sum({$<[Date Type]={'ActiveEmployeeCount'}>} [Active Employee Count]), [Date], $(='[' & GetObjectField(0) & ']')))

If I put the expression into a Pick() with a hard-coded index the expression still works properly:
Pick(2,
Avg(Aggr(Sum({$<[Date Type]={'ActiveEmployeeCount'}>} [Active Employee Count]), [Date])),
Avg(Aggr(Sum({$<[Date Type]={'ActiveEmployeeCount'}>} [Active Employee Count]), [Date], $(='[' & GetObjectField(0) & ']')))
)
When I put the expression into a Pick() using Dimensionality(), I get much different results:
Pick(Dimensionality() + 1,
Avg(Aggr(Sum({$<[Date Type]={'ActiveEmployeeCount'}>} [Active Employee Count]), [Date])),
Avg(Aggr(Sum({$<[Date Type]={'ActiveEmployeeCount'}>} [Active Employee Count]), [Date], $(='[' & GetObjectField(0) & ']')))
)
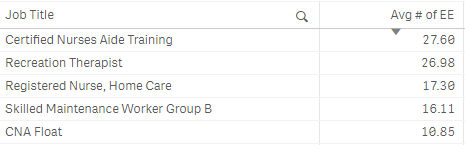
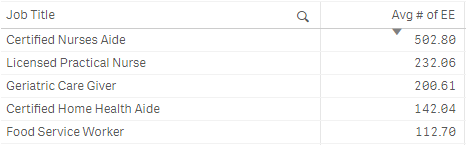
What's interesting here is that the top value I'm seeing here is the 11th value when sorted numerically so it seems like what is happening is that instead of showing me the Top 10 Job Titles (or whatever dimension(s) I'm using in the chart) like it should be, it's kicking out the Top 10 Job Titles and then starting the list with the 11th. The numbers are correct for the above pictured Job Titles but I don't understand why the chart is starting at the 11th value not the 1st.
My plan was to basically build out this expression to accommodate all of the dimensions I decide to pull into my Active Employee Counts table and be able to use this single variable/Master Item in any chart from a KPI object (where the only field I want to aggregate on is [Date]) to a straight table where I could potentially have a large number of different dimension combinations such as [Business Unit], [Location], [Department], [Job Title], etc... where I'd want to aggregate across [Date] as well as all of the other dimensions included in the table.
I've been combing through the forums trying to find an answer to this problem and I've found a ton of great information but can't quite put all of the pieces together with this particular problem.
A little more info/context just in case it may be relevant:
- Using Qlik Sense Enterprise February 2018 edition.
- I keep all of my variables in an external CSV file that get's loaded in via the Qlik Deployment Framework and then I wrap my variables with Master Items using a dollar sign expansion to utilize in charts and expose to end users for self-service purposes (e.g. my Average Number of Employees Master Items is defined as $(vL.AvgNumActiveEe) and my vL.AvgNumActiveEe variable is defined using the expression(s) above).
- Variables are going to be utilized in NPrinting reports once I can get the issues in the application itself ironed out.
- The source table where the [Active Employee Count] field is coming from is essentially just a bunch of dimension ID values with a count so that we can get accurate counts using any number of dimension combinations for any dimension included in the table:
| Date | Business Unit ID | Location ID | Department ID | Race ID | Job Title ID | Active Employee Count |
|---|---|---|---|---|---|---|
- The reason I have a Set Analysis modifier to use a [Date Type] of 'ActiveEmployeeCount' is that I'm using a generic calendar in this application as laid out by Rob Wunderlich's technique at http://qlikviewcookbook.com/recipes/download-info/tutorial-using-common-date-dimensions/
- I'm aware of the complexities that come into play when loading variables in through script as well as how complex expressions can become when nesting variables into other variables that depend on dollar-sign expansions being evaluated at just the right spot in the overall data flow but I can handle these issues using techniques identified in a number of great articles across the community. For the sake of this question I have eliminated those outside factors and I am just trying to get this to working properly when typed directly into the chart expression via the UI.
- I'm also aware that I can likely build this measure out using a Concat() but for the sake of simplicity I'm keeping this "long-hand" version to eliminate as many complicating factors as possible.
Many many thanks ahead of time for helping me find a solution!
- « Previous Replies
-
- 1
- 2
- Next Replies »
- Mark as New
- Bookmark
- Subscribe
- Mute
- Subscribe to RSS Feed
- Permalink
- Report Inappropriate Content
I am not sure what the solution is (at least without playing around with a sample), but why don't you remove dimension limits for beginner and then see what do you see? Do you ever see the top 10 or does it always begin with 11th?
- Mark as New
- Bookmark
- Subscribe
- Mute
- Subscribe to RSS Feed
- Permalink
- Report Inappropriate Content
Hi Sunny,
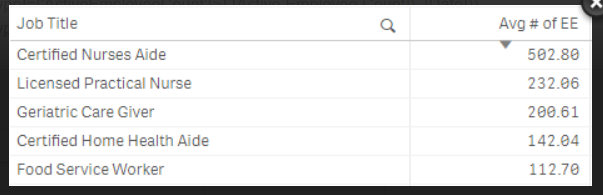
If I remove the dimension limits I do see the correct results again (as seen in one of the first two images). That's what has me really perplexed!
Also I just want to personally thank you for all of your contributions to this community! I can't tell you the number of times I've stumbled upon your solutions in all of the reading I've done over the past couple of days 
- Mark as New
- Bookmark
- Subscribe
- Mute
- Subscribe to RSS Feed
- Permalink
- Report Inappropriate Content
I am glad that I have been helpful.
Just to confirm, did you remove Dimensionality() or Dimension Limits? I wanted to test your expression without dimension limits....
Pick(Dimensionality() + 1,
Avg(Aggr(Sum({$<[Date Type]={'ActiveEmployeeCount'}>} [Active Employee Count]), [Date])),
Avg(Aggr(Sum({$<[Date Type]={'ActiveEmployeeCount'}>} [Active Employee Count]), [Date], $(='[' & GetObjectField(0) & ']')))
)
- Mark as New
- Bookmark
- Subscribe
- Mute
- Subscribe to RSS Feed
- Permalink
- Report Inappropriate Content
I removed the Dimension Limits but kept the Dimensionality() + 1
- Mark as New
- Bookmark
- Subscribe
- Mute
- Subscribe to RSS Feed
- Permalink
- Report Inappropriate Content
When you did that, did you see everything (all Job Titles) or just this?
- Mark as New
- Bookmark
- Subscribe
- Mute
- Subscribe to RSS Feed
- Permalink
- Report Inappropriate Content
Would you be able to create a mock up data so that we can see the issue?
- Mark as New
- Bookmark
- Subscribe
- Mute
- Subscribe to RSS Feed
- Permalink
- Report Inappropriate Content
After removing the Dimension Limits it goes back to showing all Job Titles but they are sorted correctly from highest to lowest Average Number of Employees
- Mark as New
- Bookmark
- Subscribe
- Mute
- Subscribe to RSS Feed
- Permalink
- Report Inappropriate Content
How about using this instead of dimensions limits?
If(
Rank( TOTAL
Pick(Dimensionality() + 1,
Avg(Aggr(Sum({$<[Date Type]={'ActiveEmployeeCount'}>} [Active Employee Count]), [Date])),
Avg(Aggr(Sum({$<[Date Type]={'ActiveEmployeeCount'}>} [Active Employee Count]), [Date], $(='[' & GetObjectField(0) & ']')))
)) < 11,
Pick(Dimensionality() + 1,
Avg(Aggr(Sum({$<[Date Type]={'ActiveEmployeeCount'}>} [Active Employee Count]), [Date])),
Avg(Aggr(Sum({$<[Date Type]={'ActiveEmployeeCount'}>} [Active Employee Count]), [Date], $(='[' & GetObjectField(0) & ']')))
))
- Mark as New
- Bookmark
- Subscribe
- Mute
- Subscribe to RSS Feed
- Permalink
- Report Inappropriate Content
I could certainly upload a mock up but it would take me some time to anonymize the data first...
- « Previous Replies
-
- 1
- 2
- Next Replies »