Unlock a world of possibilities! Login now and discover the exclusive benefits awaiting you.
- Qlik Community
- :
- Forums
- :
- Analytics
- :
- New to Qlik Analytics
- :
- Dashboard creation
- Subscribe to RSS Feed
- Mark Topic as New
- Mark Topic as Read
- Float this Topic for Current User
- Bookmark
- Subscribe
- Mute
- Printer Friendly Page
- Mark as New
- Bookmark
- Subscribe
- Mute
- Subscribe to RSS Feed
- Permalink
- Report Inappropriate Content
Dashboard creation
Hi!
I am new to clik sense desktop and I am facing some issues :
My excel data has a dimension called "Domain", this dimension is composed of 8 different string values
I want to create a dashboard with 8 gauges. These gauges all have the same measure (Avg(grade)) but I need them to calculate it for the 8 different values of my domain (one for each). I cannot use a filter because I want all the gauges to show their values at the same time on the same sheet (like a dashboard).
Can anyone help me please?
I'm sur some kind of coding in the expression case condition of each gauge must work but I have no idea how.
Thanks a lot!
Simon
- Tags:
- calculation help
- Mark as New
- Bookmark
- Subscribe
- Mute
- Subscribe to RSS Feed
- Permalink
- Report Inappropriate Content
If you make Domain your Dimension and then use your measure you will automatically get the values calculated per dimension value.
- Mark as New
- Bookmark
- Subscribe
- Mute
- Subscribe to RSS Feed
- Permalink
- Report Inappropriate Content
Hi Mark,
Thanks for taking the time to answer,
I don't fully understand your idea "if you make Domain your dimension". When you in sert a gauge in clik sense desktop, you can only add a measure and no dimension...
Thank you
Simon
- Mark as New
- Bookmark
- Subscribe
- Mute
- Subscribe to RSS Feed
- Permalink
- Report Inappropriate Content
Sounds like you need to use set analysis and create 8 chart one per domain.
Best regards
Andy
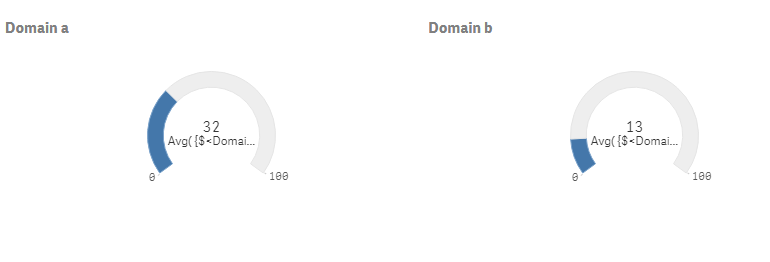
Simple example attached with just 2 gauges
- Mark as New
- Bookmark
- Subscribe
- Mute
- Subscribe to RSS Feed
- Permalink
- Report Inappropriate Content
Thanks Andy, i'll take a look at set analysis then;
I solved my problem by creating a new table with a proper layout in Excel but I wanted to check if it was possible to reach the same result only in clik sense.
- Mark as New
- Bookmark
- Subscribe
- Mute
- Subscribe to RSS Feed
- Permalink
- Report Inappropriate Content
I believe there is a trellis extension in qlik branch you can use to generate the gauge per dimension value. I'd look there for your solution. Set analysis although will work will need maintaining each time you add or remove a value.
Regards
Andy
- Mark as New
- Bookmark
- Subscribe
- Mute
- Subscribe to RSS Feed
- Permalink
- Report Inappropriate Content
Hi Simon,
The answer of Andy it rights. You can create 8 separate gauge charts.
Each chart has a different measure:
Instead of using "Avg(grade)" you need to add the domain within the measure:
gauge chart 1:=Avg({1<Domain='A'>}grade)
gauge chart 2:=Avg({1<Domain='B'>}grade)
The '1' means: ignore all selections. the <> means: calculate only for this domain.
The suggested $ is also OK when the gauge chart should react on other filters.
- Mark as New
- Bookmark
- Subscribe
- Mute
- Subscribe to RSS Feed
- Permalink
- Report Inappropriate Content
Thank you ! I will try all this
Thanks for the tips
- Mark as New
- Bookmark
- Subscribe
- Mute
- Subscribe to RSS Feed
- Permalink
- Report Inappropriate Content
Works perfectly indeed,
Thanks again