Unlock a world of possibilities! Login now and discover the exclusive benefits awaiting you.
- Qlik Community
- :
- All Forums
- :
- QlikView App Dev
- :
- Re: Calculated Dimension with Set Analysis
- Subscribe to RSS Feed
- Mark Topic as New
- Mark Topic as Read
- Float this Topic for Current User
- Bookmark
- Subscribe
- Mute
- Printer Friendly Page
- Mark as New
- Bookmark
- Subscribe
- Mute
- Subscribe to RSS Feed
- Permalink
- Report Inappropriate Content
Calculated Dimension with Set Analysis
Hi
I have a set of data from 2015 to 2018 however I will like to create a calculated dimension for a chart that only displays data from 2016 to 2018 but I will also add a filter to the tab where the user can select to see the 2015 data if they want to just won't show in the chart as the default view.
Any help.
Thank you
- Mark as New
- Bookmark
- Subscribe
- Mute
- Subscribe to RSS Feed
- Permalink
- Report Inappropriate Content
This is the expression I am currently using
=sum({$<metric_name={'Non-Billable Cost'}>} metrictotal)/sum(hours_units)
How can I adjust this to fit your expression or do you think possibly I calculated dimension will be best. My dimension now is "Year" which is from 2015 to 2018.
- Mark as New
- Bookmark
- Subscribe
- Mute
- Subscribe to RSS Feed
- Permalink
- Report Inappropriate Content
I am looking to have the default view of a particular chart show from 2016 to 2018 but I will also add a year filter where the user can select to see 2015 data if they want to.
This is the expression I am currently using
=sum({$<metric_name={'Non-Billable Cost'}>} metrictotal)/sum(hours_units)
How can I adjust this to fit your expression or do you think possibly I calculated dimension will be best. My dimension now is "Year" which is from 2015 to 2018.
- Mark as New
- Bookmark
- Subscribe
- Mute
- Subscribe to RSS Feed
- Permalink
- Report Inappropriate Content
This is the expression I am currently using
=sum({$<metric_name={'Non-Billable Cost'}>} metrictotal)/sum(hours_units)
How can I adjust this to fit your expression or do you think possibly I calculated dimension will be best. My dimension now is "Year" which is from 2015 to 2018.
Are you suggesting I use your expression as a calculated dimension.
- Mark as New
- Bookmark
- Subscribe
- Mute
- Subscribe to RSS Feed
- Permalink
- Report Inappropriate Content
This is the expression I am currently using
=sum({$<metric_name={'Non-Billable Cost'}>} metrictotal)/sum(hours_units)
How can I adjust this to fit your expression or do you think possibly I calculated dimension will be best. My dimension now is "Year" which is from 2015 to 2018.
- Mark as New
- Bookmark
- Subscribe
- Mute
- Subscribe to RSS Feed
- Permalink
- Report Inappropriate Content
The set Analysis will limit the dimension and the result to 2015 if selected or 2015,2016,2016, you don't need a calculated dimension.
put this in an expression.
=IF(GetSelectedCount(Year)>0,Sum({<Year = {'$(=Max(Year))'},metric_name={'Non-Billable Cost'}>} metrictotal)/sum(hours_units) , Sum({<Year = {'2016','2017','2018'},metric_name={'Non-Billable Cost'}>} metrictotal)/sum(hours_units))
- Mark as New
- Bookmark
- Subscribe
- Mute
- Subscribe to RSS Feed
- Permalink
- Report Inappropriate Content
Thank you so much for your quick response. With this expression will the user be able to select and view 2015 data?
- Mark as New
- Bookmark
- Subscribe
- Mute
- Subscribe to RSS Feed
- Permalink
- Report Inappropriate Content
Yes but just if they select the 2015, if not, they will see from 2016 to 2018.
- Mark as New
- Bookmark
- Subscribe
- Mute
- Subscribe to RSS Feed
- Permalink
- Report Inappropriate Content
Please see the image. The 2015 line is actually flat now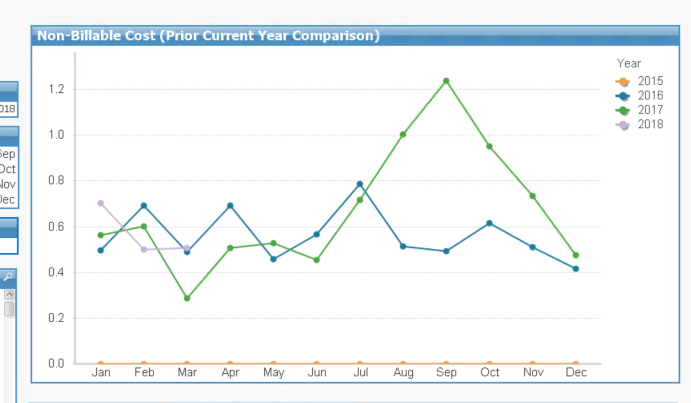
- Mark as New
- Bookmark
- Subscribe
- Mute
- Subscribe to RSS Feed
- Permalink
- Report Inappropriate Content
May be this?
If(GetSelectedCount(Year)=0, sum({$<metric_name={'Non-Billable Cost'}, Year = {2016, 2017, 2018}>} metrictotal)/sum({<Year = {2016, 2017, 2018}>}hours_units), sum({$<metric_name={'Non-Billable Cost'}>} metrictotal)/sum(hours_units))
- Mark as New
- Bookmark
- Subscribe
- Mute
- Subscribe to RSS Feed
- Permalink
- Report Inappropriate Content
This expression worked however the legend still shows 2015 but the lines just show 2016 to 2018. How can I not make the legend show 2015?
Thank you