Unlock a world of possibilities! Login now and discover the exclusive benefits awaiting you.
- Qlik Community
- :
- Forums
- :
- Analytics
- :
- New to Qlik Analytics
- :
- Re: Restrict Line Chart Till the Month where value...
- Subscribe to RSS Feed
- Mark Topic as New
- Mark Topic as Read
- Float this Topic for Current User
- Bookmark
- Subscribe
- Mute
- Printer Friendly Page
- Mark as New
- Bookmark
- Subscribe
- Mute
- Subscribe to RSS Feed
- Permalink
- Report Inappropriate Content
Restrict Line Chart Till the Month where value is available
Hello!
I have used a combo chart showing Budget, Last year and current year values. I don't want to show values for months that haven't happened yet and want the line chart to stop at March. Attached is an image (Chart 1) showing the same. Please let me know how this can achieved and if there is an expression that can be added to the specific measure in order to get the desired result.
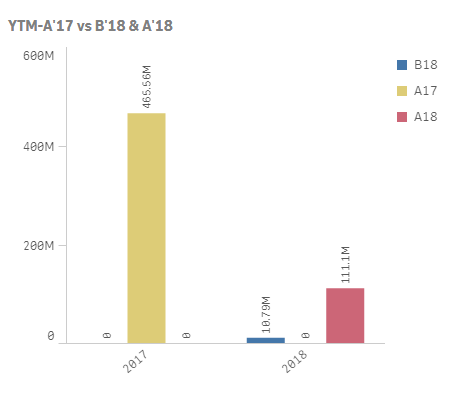
Secondly, I have a bar chart where I have added the following expression =if([Year]='2017'or [Year]='2018',[Year]) in dimensions, so that values for only these 2 years and 2018 Budget are shown. However, I see 0 values which keep showing up in between the bars. Attached is the image (Chart 2).
Please let me know how I can fix these issues.
Thanks,
Rony
- Mark as New
- Bookmark
- Subscribe
- Mute
- Subscribe to RSS Feed
- Permalink
- Report Inappropriate Content
Hello Guys,
I am still not able to get rid of the zeroes/ gaps between the columns. Is there anything else that I can try? Please advice. Attached is the image.
Regards,
Rony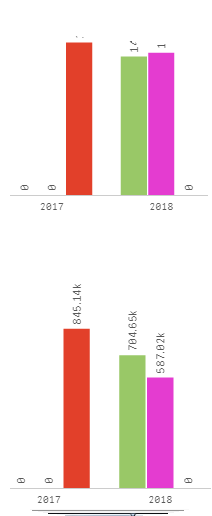
- Mark as New
- Bookmark
- Subscribe
- Mute
- Subscribe to RSS Feed
- Permalink
- Report Inappropriate Content
Hi Ron,
Did you check the two bar charts in the app i sent ?
Thomas Le Gall
Le mer. 9 mai 2018 à 15:10, Ron M <qcwebmaster@qlikview.com> a écrit :
- Mark as New
- Bookmark
- Subscribe
- Mute
- Subscribe to RSS Feed
- Permalink
- Report Inappropriate Content
Ron:
Try using the same if expression for the bar chart expression too. That should help you out.
if(BarChartExpr = 0, null(), BarChartExpr)
This way - null labels will not be displayed. Let me know if your issue is fixed this way - else share the actual app and we'll work it out.

Rgds,
Benazir
- Mark as New
- Bookmark
- Subscribe
- Mute
- Subscribe to RSS Feed
- Permalink
- Report Inappropriate Content
Hi Thomas and Benazir,
Thanks a lot for your help!
Thomas,
I did check the app you sent. The first bar chart where the dimension is =’ ‘works. Could you explain this expression to me? Also, when I apply this expression, the x-axis labels disappear. Is there any way to add these labels?
Benazir,
You were right about using the same 'if' expression. It works now. Thank you.
Apart from this, I want to add growth rates for Actual 2018 over 2017 and Actual 2018 over Budget in Chart 3. How can I achieve this?
Regards,
Rony
- Mark as New
- Bookmark
- Subscribe
- Mute
- Subscribe to RSS Feed
- Permalink
- Report Inappropriate Content
Chart 3 is the same Year to Date Chart attached above.
Regards,
Rony
- Mark as New
- Bookmark
- Subscribe
- Mute
- Subscribe to RSS Feed
- Permalink
- Report Inappropriate Content
The space is due to zero/null values - this space could've been avoided in Qlikview using enable conditions on the expressions - but I can't find how to implement the same in Qlik Sense. Will let you know if I figure something out.
Rgds,
B
- Mark as New
- Bookmark
- Subscribe
- Mute
- Subscribe to RSS Feed
- Permalink
- Report Inappropriate Content
Do you mean you want these expressions stacked on top of each other? If you can possibly share the actual app - we could work faster.
>Benazir
- Mark as New
- Bookmark
- Subscribe
- Mute
- Subscribe to RSS Feed
- Permalink
- Report Inappropriate Content
Hi Benazir,
I do not want the expressions to be stacked on top of each other. Sorry for the improper explanation. In the app, the three columns in the third chart contains Actual Sales data for 2017 and Actual Sales and Budget data for 2018. I want to add growth rates for Actual 2017 when compared to Actual 2018 and Actual 2018 compared to Budget 2018. How can I achieve this? I am attaching an image to show how I want the growth rates to appear. I am not getting the option to attach the app here so I am emailing it to qcwebmaster@qlikview.com. Its a trial app. 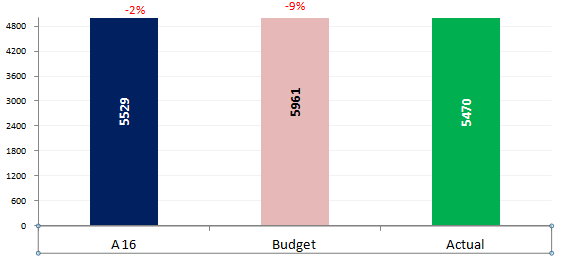
Regards,
Rony
- Mark as New
- Bookmark
- Subscribe
- Mute
- Subscribe to RSS Feed
- Permalink
- Report Inappropriate Content
In the image, A16 should actually be A17.
Regards,
Rony
- Mark as New
- Bookmark
- Subscribe
- Mute
- Subscribe to RSS Feed
- Permalink
- Report Inappropriate Content
While replying, try using the advanced editor option on the upper right of the reply window. In that option you'll get the attach option
PS: Ron, this thread has been marked answered - perhaps you can open a new thread with the new requirements? Me and a lot of other experts will be able to answer in that thread.
Rgds
B