Unlock a world of possibilities! Login now and discover the exclusive benefits awaiting you.
- Qlik Community
- :
- Forums
- :
- Analytics
- :
- New to Qlik Analytics
- :
- Re: Benchmarking
- Subscribe to RSS Feed
- Mark Topic as New
- Mark Topic as Read
- Float this Topic for Current User
- Bookmark
- Subscribe
- Mute
- Printer Friendly Page
- Mark as New
- Bookmark
- Subscribe
- Mute
- Subscribe to RSS Feed
- Permalink
- Report Inappropriate Content
Benchmarking
I have a data set which contains a few attributes of certain cities. For eg, population, no of cars, area etc. In my design (mockup below),the page is split in two halves where one half would represent the figures of the home city and the other would represent that of the benchmark. The user has the option to select the home branch (one in count) and the benchmark (can be multiple).
For the dataset, there is a single table which has the attributes of all the cities. Wanted to know how to go about doing this?

Accepted Solutions
- Mark as New
- Bookmark
- Subscribe
- Mute
- Subscribe to RSS Feed
- Permalink
- Report Inappropriate Content
I would do the following load in the script: Load distinct City AS SingleCity Resident <dataset>; This makes a table with one field named singlecity. In your front end you can put a listbox with this field. to select the single city. Within the calculations of the single city part of the sheet you can then use set analysis. if you don't know how to use set analysis you should look up some videos and such to get you started. So for this singlecity side use something like this: {<city={$(=max(singlecity))}>}
- Mark as New
- Bookmark
- Subscribe
- Mute
- Subscribe to RSS Feed
- Permalink
- Report Inappropriate Content
Hard to answer without more information.
I think you would need to use Set Analysis to control what changes on each side based on the filter choices.
The 2 filters would need to be separate lists of cities so that you could specify in the Set Analysis.
If you can provide more details about the data I can give you a better answer.
- Mark as New
- Bookmark
- Subscribe
- Mute
- Subscribe to RSS Feed
- Permalink
- Report Inappropriate Content
You will need to use set analysis to have values for 2 different selections. and use a fieldlist or dummy table that is not connected to the data to select your home city.
With the set analysis you then check what the homecity selected is and input that as set analysis to the calculations. for the other side you use normal sellections. Hope this was clear enough. 
- Mark as New
- Bookmark
- Subscribe
- Mute
- Subscribe to RSS Feed
- Permalink
- Report Inappropriate Content
Hi Mark,
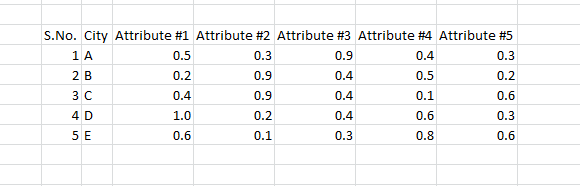
A rough view of the dataset would be like this:

- Mark as New
- Bookmark
- Subscribe
- Mute
- Subscribe to RSS Feed
- Permalink
- Report Inappropriate Content
Hi Bram,
Sorry, but I am fairly new to Qliksense. Can you please elaborate more on this? You can use the below mentioned dataset for reference:
- Mark as New
- Bookmark
- Subscribe
- Mute
- Subscribe to RSS Feed
- Permalink
- Report Inappropriate Content
I would do the following load in the script: Load distinct City AS SingleCity Resident <dataset>; This makes a table with one field named singlecity. In your front end you can put a listbox with this field. to select the single city. Within the calculations of the single city part of the sheet you can then use set analysis. if you don't know how to use set analysis you should look up some videos and such to get you started. So for this singlecity side use something like this: {<city={$(=max(singlecity))}>}
- Mark as New
- Bookmark
- Subscribe
- Mute
- Subscribe to RSS Feed
- Permalink
- Report Inappropriate Content
Hi Bram,
Thanks for your response. I think I have got the gist of what you are trying to say. I would try it out for sure!
Thanks once again!
- Mark as New
- Bookmark
- Subscribe
- Mute
- Subscribe to RSS Feed
- Permalink
- Report Inappropriate Content
No problem. Goodluck