Unlock a world of possibilities! Login now and discover the exclusive benefits awaiting you.
- Qlik Community
- :
- Forums
- :
- Analytics
- :
- New to Qlik Analytics
- :
- Re: Cumulative expression request for combo chart
- Subscribe to RSS Feed
- Mark Topic as New
- Mark Topic as Read
- Float this Topic for Current User
- Bookmark
- Subscribe
- Mute
- Printer Friendly Page
- Mark as New
- Bookmark
- Subscribe
- Mute
- Subscribe to RSS Feed
- Permalink
- Report Inappropriate Content
Cumulative expression request for combo chart
Hi All,
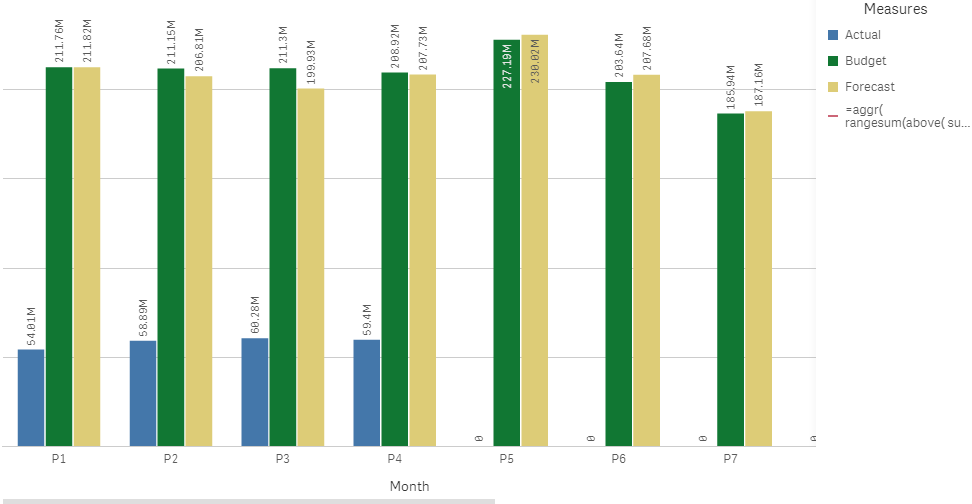
could someone please help in providing cumulative expression for line graph (Combo chart) wherein it is should look as below
This is the one which i am trying to replicate in QS
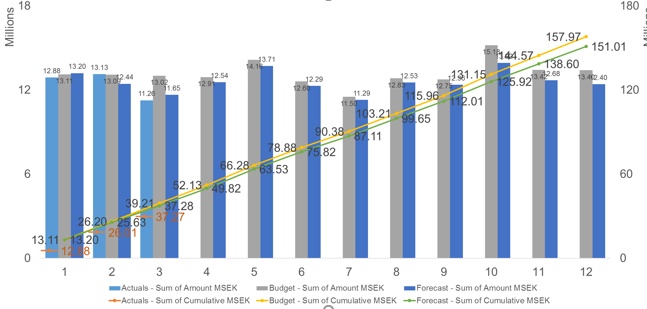
and below is the original one...
as per the requirement i have to create below views
Actuals cumulative = Only for the past months
Forecast cumulative = Actuals as of past months + future forecast (e.g. Actuals P1-P3 + Forecast P4-P12)
Show 1 decimal point
Dimension used is Month (P1,P2,P3.....P12)
Measures used are Actual, Budget and Forecast values
Thanks
Vinay
- Mark as New
- Bookmark
- Subscribe
- Mute
- Subscribe to RSS Feed
- Permalink
- Report Inappropriate Content
Would you be able to share some sample data with the expected output? or you can map be able The As-Of Table
- Mark as New
- Bookmark
- Subscribe
- Mute
- Subscribe to RSS Feed
- Permalink
- Report Inappropriate Content
Hi Sunny,
Please find the attached sample data...... i want to replicate the below chart in QS with below requirements. i am able to create bar graphs but for line graph, we have to create depending on below criteria
Actuals cumulative = Only for the past months
Forecast cumulative = Actuals as of past months + future forecast (e.g. Actuals P1-P3 + Forecast P4-P12)
Show 1 decimal point
Dimension used is Month (P1,P2,P3.....P12)
Measures used are Actual, Budget and Forecast values
Please revert for further clarifications
Thanks
Vinay

- Mark as New
- Bookmark
- Subscribe
- Mute
- Subscribe to RSS Feed
- Permalink
- Report Inappropriate Content
Just a quick question... are you doing CrossTable when you are loading this data into Qlik Sense?
- Mark as New
- Bookmark
- Subscribe
- Mute
- Subscribe to RSS Feed
- Permalink
- Report Inappropriate Content
Yes you are right, i am using cross table.....while loading the data.
- Mark as New
- Bookmark
- Subscribe
- Mute
- Subscribe to RSS Feed
- Permalink
- Report Inappropriate Content
can anyone help on this on priority?