Unlock a world of possibilities! Login now and discover the exclusive benefits awaiting you.
- Qlik Community
- :
- Forums
- :
- Analytics
- :
- New to Qlik Analytics
- :
- Re: QlikSense Dimension: show all user selected va...
- Subscribe to RSS Feed
- Mark Topic as New
- Mark Topic as Read
- Float this Topic for Current User
- Bookmark
- Subscribe
- Mute
- Printer Friendly Page
- Mark as New
- Bookmark
- Subscribe
- Mute
- Subscribe to RSS Feed
- Permalink
- Report Inappropriate Content
QlikSense Dimension: show all user selected values regardless of not having data
Hello,
We are attempting to trend Sales over the past 3 years by period using a line chart. Unfortunately, when a period has no sales it sorts to the beginning of the chart. For instance, if there are no sales in periods 5-12, our line chart sorts from 5-12 then 1-4 instead of 1-12 which is what we would want. It appears this is occurring because we have no period entries for months 5-12 so we have no dimension to sort on. Is there a way in the sort by expression on the line chart to incorporate the users selections (getuserselections) as the sort order and to show zero when there are no sales for a particular period? (The years/periods are a filter on the app sheet.) I know how to get the user selections into a variable and into a dimension but I don't know how to use that dimension to sort on the line graph.
Get user selections for a full year would look like this: '201801','201802','201803','201804','201805','201806','201807','201808','201809','201810','201811','201812'
The months with data in the example above are 201801, 201802, 201803, 201804
Even though the line chart has zero sales entries for all the user's selections, it does not sort correctly since the sort expression in the line chart is based on Year and Month. We cannot sort by period since we can cross fiscal years in our Year/Period filter.
- Mark as New
- Bookmark
- Subscribe
- Mute
- Subscribe to RSS Feed
- Permalink
- Report Inappropriate Content
1. use the continuous dimension in the line chart properties (but your Period field must be a date !!)
2. or create a master calendar in your script, and adapt your expression so it always returns a value (0 or the actual sales)
sum(Sales) + sum({1}Sales)*0 (careful, may have some other undesired effects)
3. similar to n°2: in your script, create at least one entry per period (containing the Sales value or 0)
- Mark as New
- Bookmark
- Subscribe
- Mute
- Subscribe to RSS Feed
- Permalink
- Report Inappropriate Content
Could you use the value list function for this?
- Mark as New
- Bookmark
- Subscribe
- Mute
- Subscribe to RSS Feed
- Permalink
- Report Inappropriate Content
Hi Ann, following point '2' of Mikael answer... to show the dates they should be previously loaded, this can be done using a master calendar that has all the dates loaded.
On other words, Qlik won't paint '201805' for Period field it this field doesn't have this value, so you need to generate all values for Period field.
LET vStart=Num('01/01/2018');
LET vEnd=Num('31/12/2018');
Load Date, Month(Date) as Month,Date(MonthStart(Date), 'YYYYMM') as Period … ;
Load Date($(vStart) + RecNo()-1) as Date autogenerate $(vEnd) - $(vStart) +1;
This calendar generates all dates between 01/01/2018 and 31/12/2018 with it's Period value
Additional modifications on dimension/expression may be required to ignore selections.
- Mark as New
- Bookmark
- Subscribe
- Mute
- Subscribe to RSS Feed
- Permalink
- Report Inappropriate Content
Thank you for your response.
The problem is the dimension will not necessarily be continuous for any certain period of time.
The user can select any number of months. They can select December and January, or Jan, Feb, Jun.
I can make this chart work if there's a way in the sort by expression on the line chart to incorporate the users selections (getuserselections) as the sort order and to show zero when there are no sales for a particular period.
If the user selects 01,02,03 and 02 has no sales can I read the users selections and make 02 = 0 Sales so that all 3 months show on the chart?
- Mark as New
- Bookmark
- Subscribe
- Mute
- Subscribe to RSS Feed
- Permalink
- Report Inappropriate Content
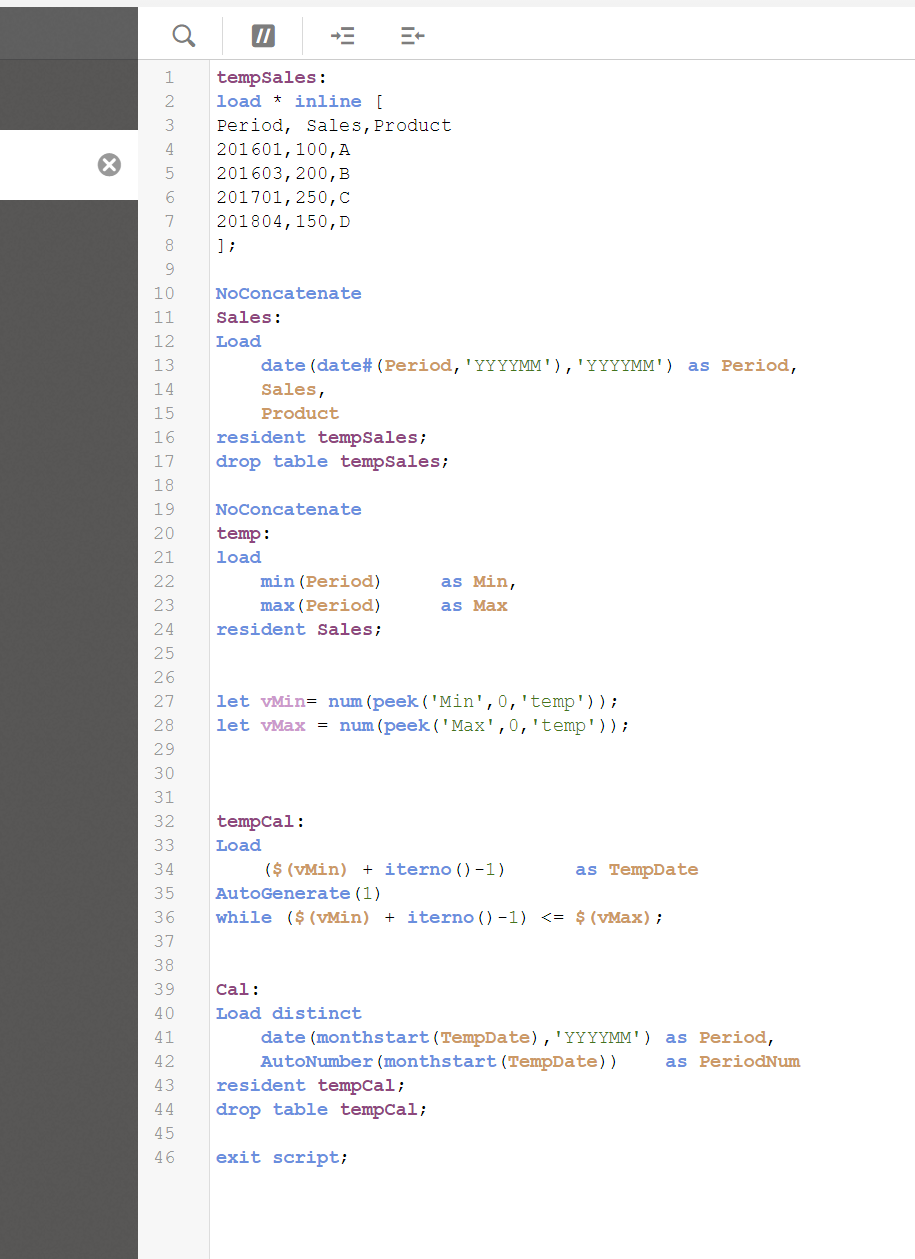
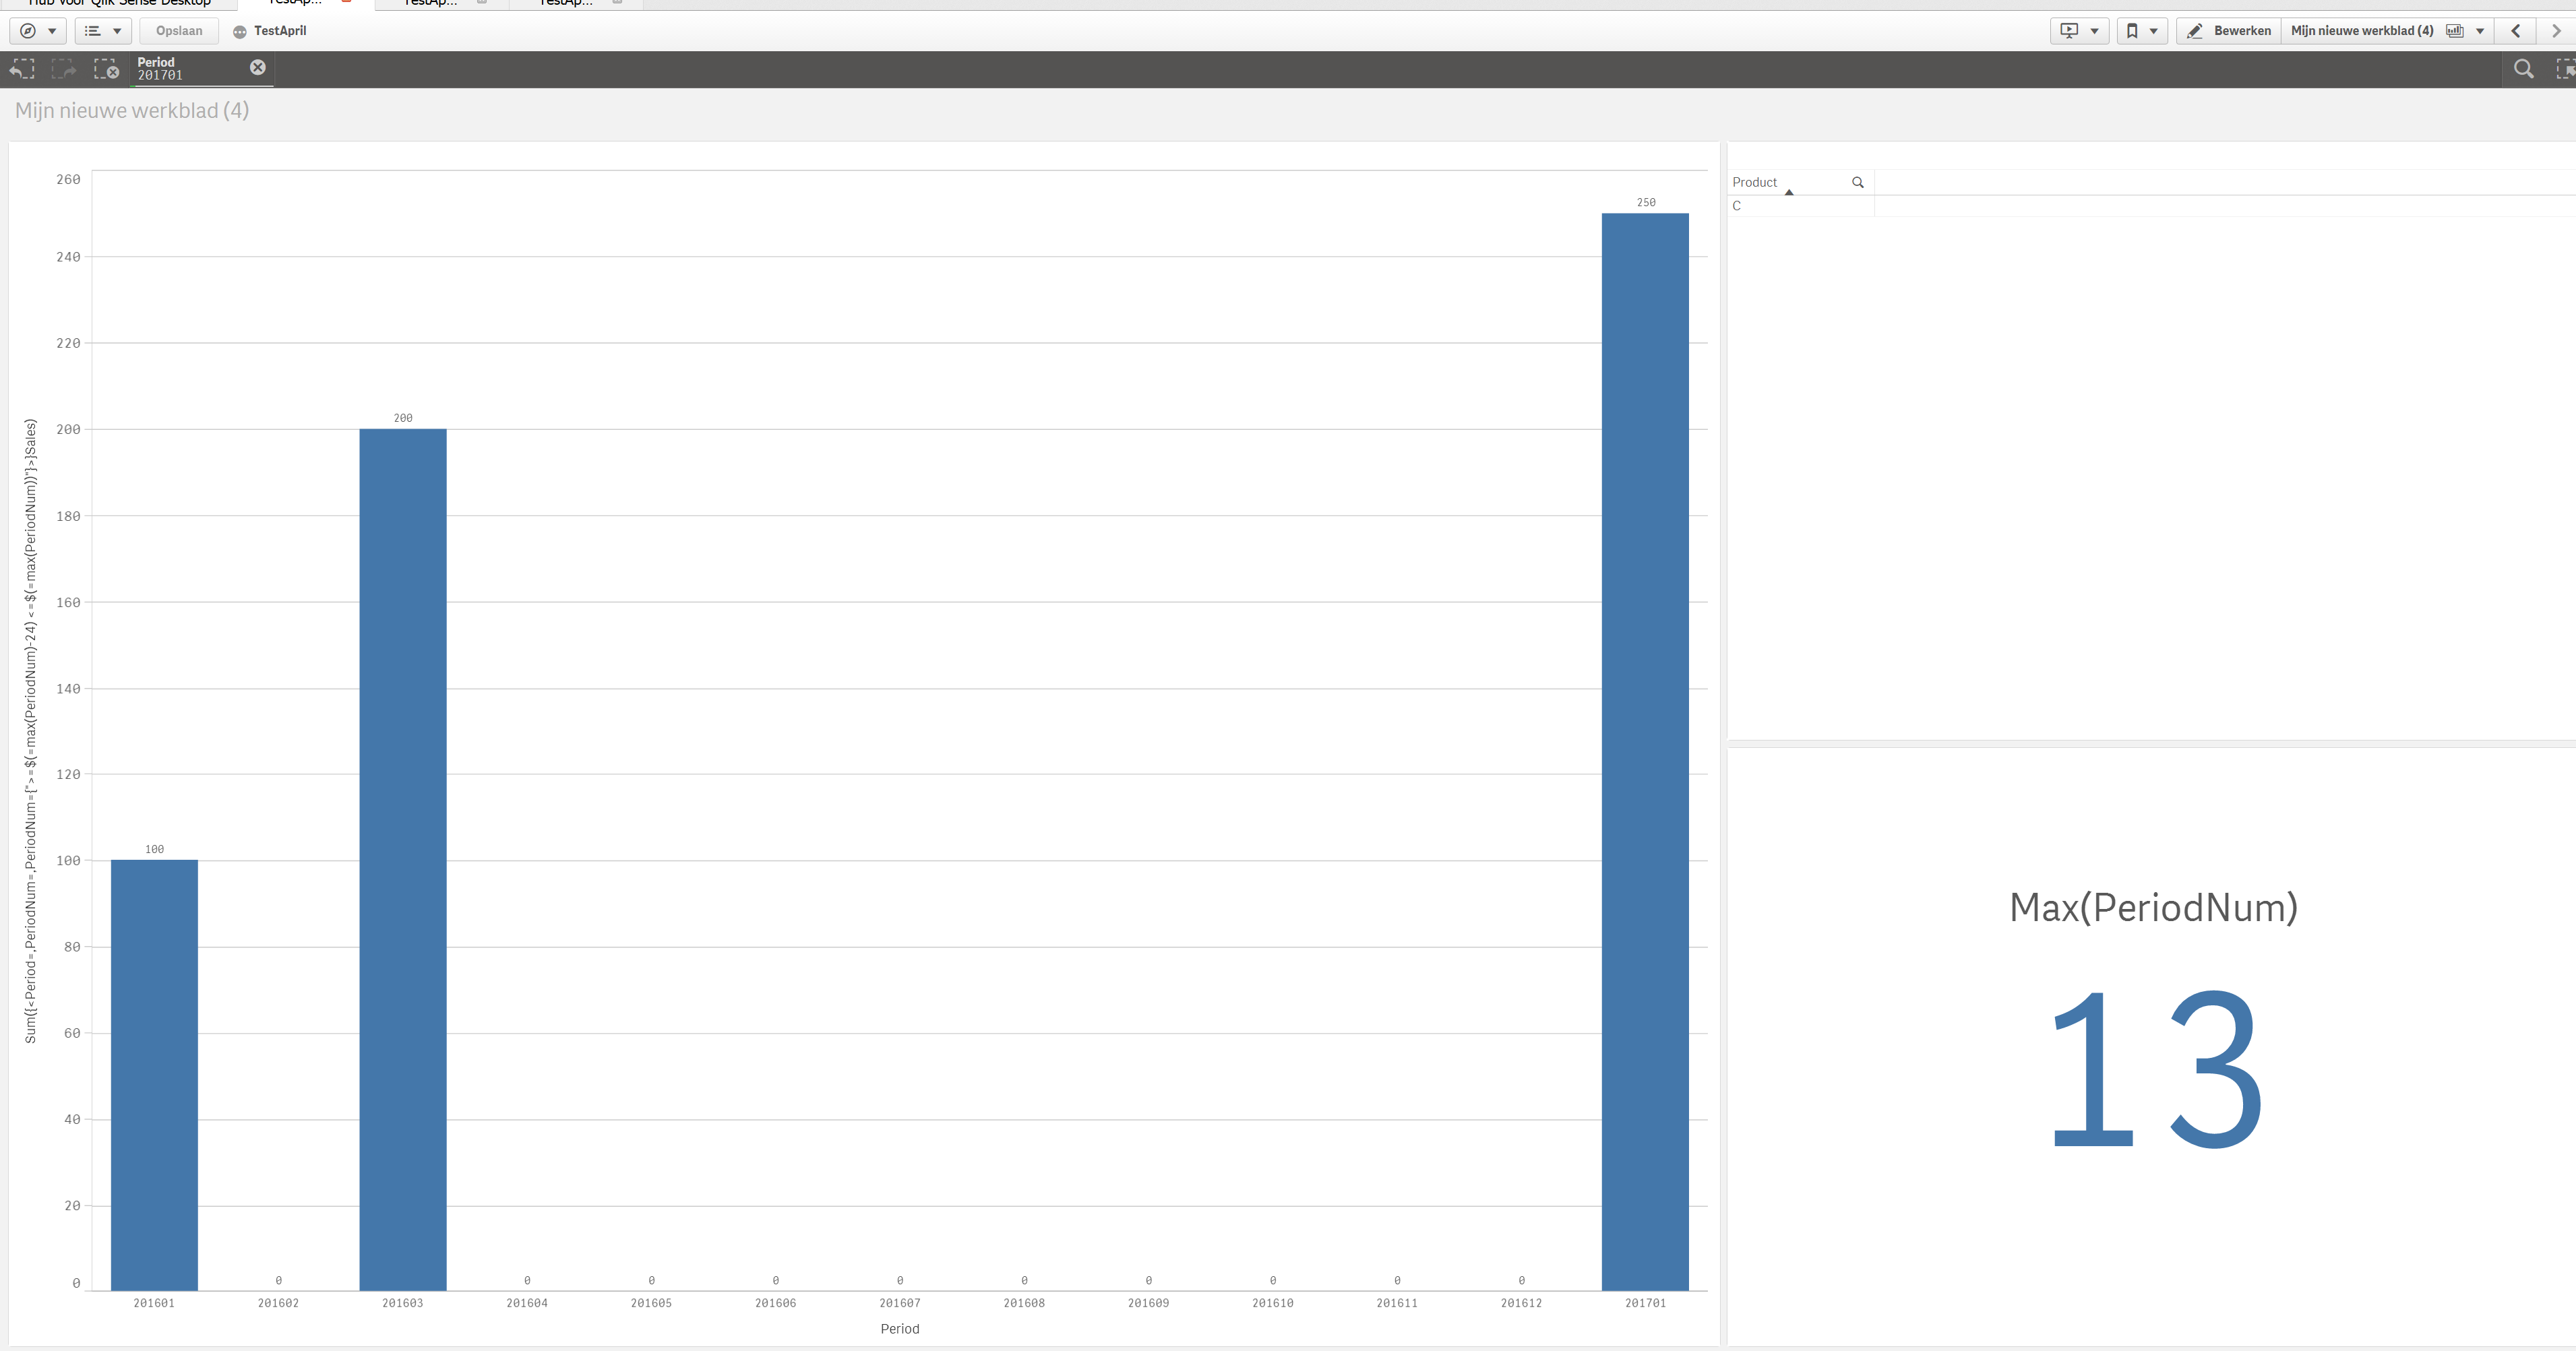
that's exactly what a master calendar is for.
my suggestion:
- create a master calendar (containing the fields: period, year, month, quarter,... whatever you want ) but certainly containing a numerical value for each period (PeriodNumber = 1,2,3,4,5,6,7,8,9,...)
- use an expression in your set analysis to show the latest 36 months (PeriodNumber = {">=$(=max(PeriodNumber)-36)"}
- don't forget to ignore all selections on any other relevant field (Period=, PeriodNumber=, Month=,...)
- Mark as New
- Bookmark
- Subscribe
- Mute
- Subscribe to RSS Feed
- Permalink
- Report Inappropriate Content
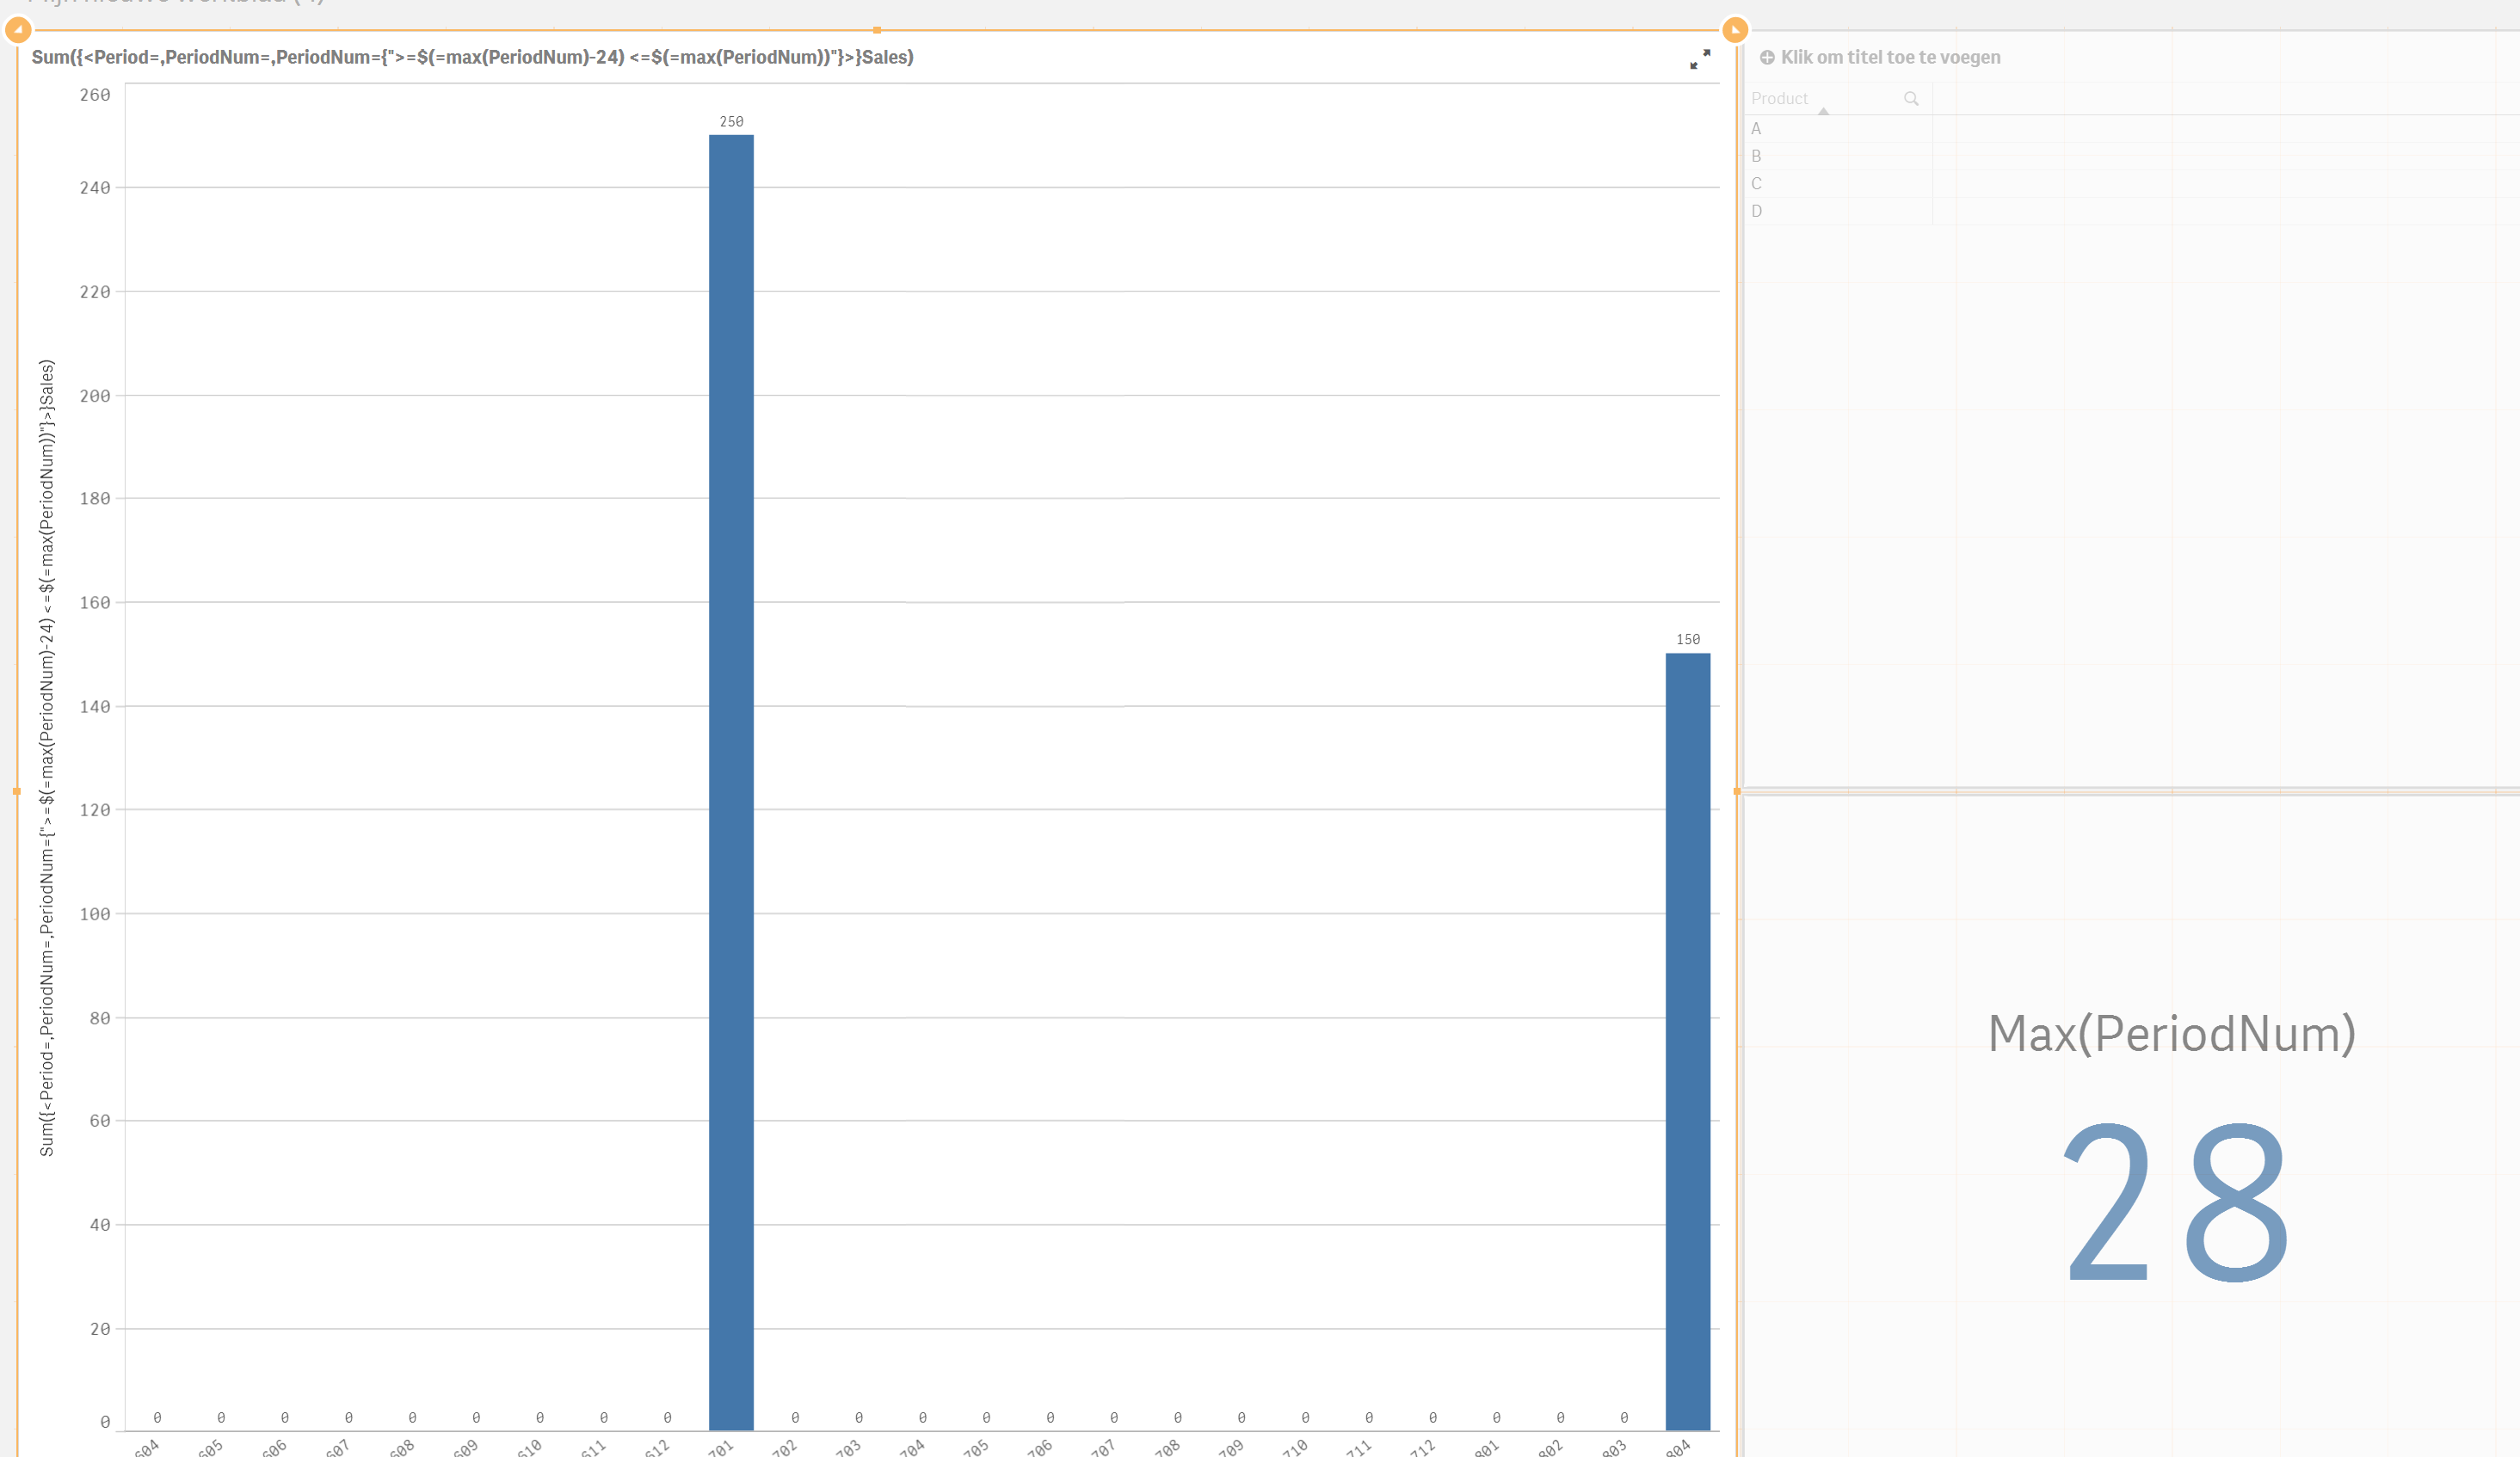
for n° 2:
PeriodNum={">=$(=max(PeriodNum)-36) <=$(=max(PeriodNum))"}
(otherwise greater values are also possible)
- Mark as New
- Bookmark
- Subscribe
- Mute
- Subscribe to RSS Feed
- Permalink
- Report Inappropriate Content