Unlock a world of possibilities! Login now and discover the exclusive benefits awaiting you.
- Qlik Community
- :
- All Forums
- :
- QlikView App Dev
- :
- Axe X on chart
- Subscribe to RSS Feed
- Mark Topic as New
- Mark Topic as Read
- Float this Topic for Current User
- Bookmark
- Subscribe
- Mute
- Printer Friendly Page
- Mark as New
- Bookmark
- Subscribe
- Mute
- Subscribe to RSS Feed
- Permalink
- Report Inappropriate Content
Axe X on chart
Hi everyone,
I've read a lot of questions about to draw a X line on a chart.
But I did not found a solution.
Is it possible in QlikView to draw a red line like in the screenshoot or not ?
Thanks
Adrian
- Mark as New
- Bookmark
- Subscribe
- Mute
- Subscribe to RSS Feed
- Permalink
- Report Inappropriate Content
Hi,
The line you ask about it is calculated or it is just indicator sort of use in the application.
Regards
Anand
- Mark as New
- Bookmark
- Subscribe
- Mute
- Subscribe to RSS Feed
- Permalink
- Report Inappropriate Content
Thanks for your answer
It s calculated
I have used "Combo chart" to try to by pass this problem, but ... I don't like it..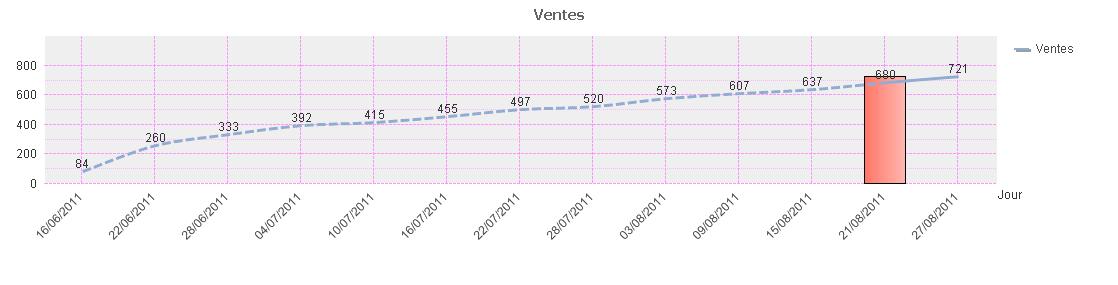
- Mark as New
- Bookmark
- Subscribe
- Mute
- Subscribe to RSS Feed
- Permalink
- Report Inappropriate Content
Hi,
Ok it is good to use combo i suggest if you decrease the size of the bar graph and use it.
Regards
Anand
- Mark as New
- Bookmark
- Subscribe
- Mute
- Subscribe to RSS Feed
- Permalink
- Report Inappropriate Content
Ok ! thanks
If i want to decreased the size of the bar, it's in the chart properties > Presentation > Bar settings ?
This is the only option that i have ?
I ask this because in the screenshot I change the option to 8 for bar distance and 8 to cluster distance, and I can't reduce more !