Unlock a world of possibilities! Login now and discover the exclusive benefits awaiting you.
- Qlik Community
- :
- Forums
- :
- Analytics
- :
- New to Qlik Analytics
- :
- Re: exclude the outlier in histogram
- Subscribe to RSS Feed
- Mark Topic as New
- Mark Topic as Read
- Float this Topic for Current User
- Bookmark
- Subscribe
- Mute
- Printer Friendly Page
- Mark as New
- Bookmark
- Subscribe
- Mute
- Subscribe to RSS Feed
- Permalink
- Report Inappropriate Content
exclude the outlier in histogram
Hi,
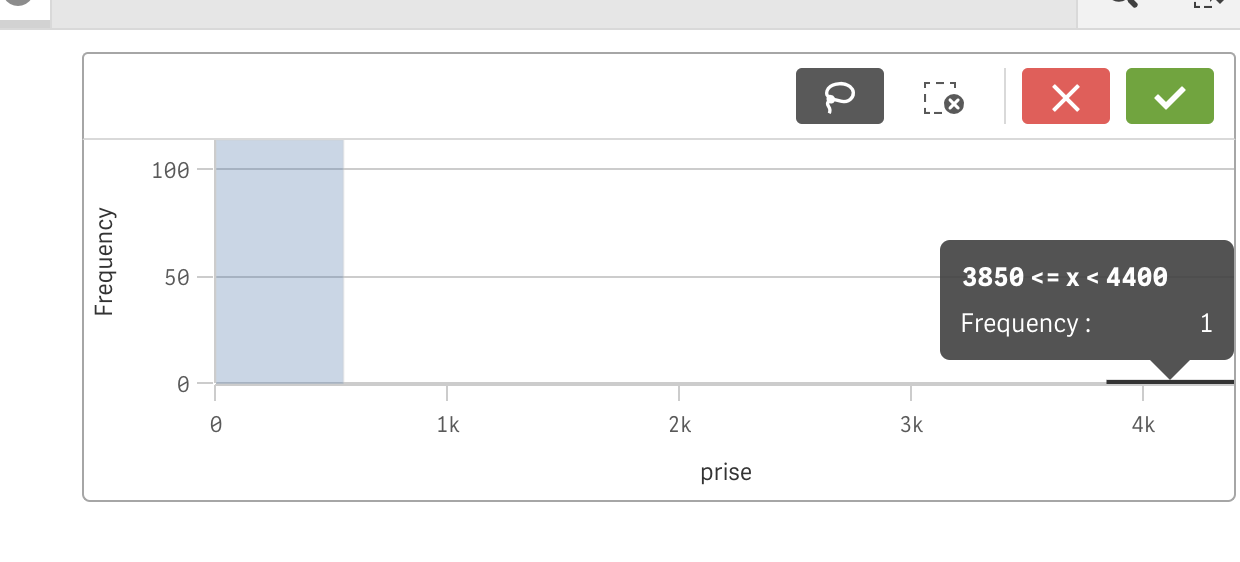
wondering I create a histogram. the average price is around 20-100 but have one outlier (bad datapoint) about 4000
is that any easy way (only use dashboard) to exclude it then can make the histogram more pretty (in right scare)
Any suggesting methord to solve this without change underline data (loading data)
Thank you!
- Mark as New
- Bookmark
- Subscribe
- Mute
- Subscribe to RSS Feed
- Permalink
- Report Inappropriate Content
I try to use
=if(prise<(max(prise)-1),prise)
in the data selection field but does not work. any suggestion? Thank you!
- Mark as New
- Bookmark
- Subscribe
- Mute
- Subscribe to RSS Feed
- Permalink
- Report Inappropriate Content
Since, this is a histogram, you won't be able to perform any calculation in the this particular chart. You have two options
1) Create a bar chart with your own buckets
2) Modify the script to create a new price field which already exclude the outliers. something like this
Table:
LOAD ...,
price
FROM ....;
Left Join (Table)
LOAD Stdev(price) as StdevPrice,
Avg(price) as AvgPrice
Resident Table;
FinalTable:
LOAD *,
If(price > AvgPrice - 3*StdevPrice and price < AvgPrice + 3*StdevPrice, price) as new_price
Resident Table;
DROP Table Table;
- Mark as New
- Bookmark
- Subscribe
- Mute
- Subscribe to RSS Feed
- Permalink
- Report Inappropriate Content
I add a description in the data load editor
saying
where [prise]<4000
as hard coding this time. ---then I will change all the graph
but is there any way, I do not change loading data, but only use if() function to limited the data rang for the specific graph on dashboard? at the Data- Fields--prise--Field.

or should I create a variable in the dataset excluding this number (which may mean, if n>4000 then change it to 0)?
Thank you!
- Mark as New
- Bookmark
- Subscribe
- Mute
- Subscribe to RSS Feed
- Permalink
- Report Inappropriate Content
Use bar chart instead of histogram and you will be able to use the if statement