Unlock a world of possibilities! Login now and discover the exclusive benefits awaiting you.
- Qlik Community
- :
- All Forums
- :
- QlikView App Dev
- :
- Re: RangeAvg dimension
- Subscribe to RSS Feed
- Mark Topic as New
- Mark Topic as Read
- Float this Topic for Current User
- Bookmark
- Subscribe
- Mute
- Printer Friendly Page
- Mark as New
- Bookmark
- Subscribe
- Mute
- Subscribe to RSS Feed
- Permalink
- Report Inappropriate Content
RangeAvg dimension
Hi,
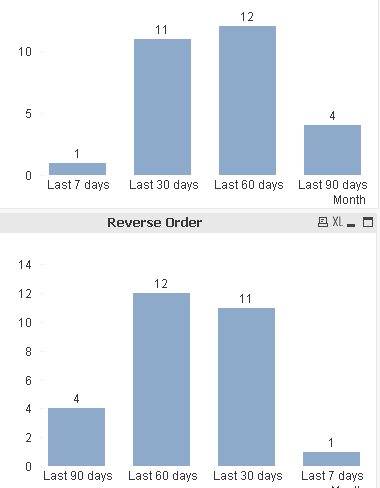
Related to my question earlier Reverse order of dimension
to reverse order of dimension when using a Range Sum but this time I want to use Rolling RangeAvg starting from current up to Last 90 days but would like it displayed as 90 --> 7 days in the x axis. Any thoughts?
What I would like to do is to reverse the order of dimension without affecting the Y values.
Thanks
- « Previous Replies
-
- 1
- 2
- Next Replies »
Accepted Solutions
- Mark as New
- Bookmark
- Subscribe
- Mute
- Subscribe to RSS Feed
- Permalink
- Report Inappropriate Content
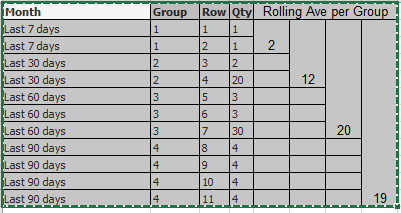
As long as your sort order is correct from the script..you can try this
Aggr(RangeAvg(Above(Sum({<[Group] = >}Qty), 0, RowNo())), Month)
Or you can use this approach if you have QV12 or above installed
- Mark as New
- Bookmark
- Subscribe
- Mute
- Subscribe to RSS Feed
- Permalink
- Report Inappropriate Content
Try the Sort options on chart
- Mark as New
- Bookmark
- Subscribe
- Mute
- Subscribe to RSS Feed
- Permalink
- Report Inappropriate Content
Hi Sudhir, I already did. Problem is I am using a Rolling RangeAvg.
- Mark as New
- Bookmark
- Subscribe
- Mute
- Subscribe to RSS Feed
- Permalink
- Report Inappropriate Content
what Sort did you try...?
- Mark as New
- Bookmark
- Subscribe
- Mute
- Subscribe to RSS Feed
- Permalink
- Report Inappropriate Content
I m unable to access the Object properties in your QVW
So i cant see your application
- Mark as New
- Bookmark
- Subscribe
- Mute
- Subscribe to RSS Feed
- Permalink
- Report Inappropriate Content
I suggest you to read what these functionality do https://help.qlik.com/en-US/qlikview/November2017/Subsystems/Client/Content/ChartFunctions/RangeFunc...
Then, Change your table into straight table for analysis purpose how this works, I would suggest you to do testing using RangeSum().
This is what i am getting, without any Range measure
So, Qlik don't know which measure you written for comparison of your sort that you need to segregate using that 
Does it make sense?
- Mark as New
- Bookmark
- Subscribe
- Mute
- Subscribe to RSS Feed
- Permalink
- Report Inappropriate Content
I used sorting by Expression. Reattached QV app As well
- Mark as New
- Bookmark
- Subscribe
- Mute
- Subscribe to RSS Feed
- Permalink
- Report Inappropriate Content
Hi Anil,
This works but I am trying to get Rolling Average and not per item in the dimension.
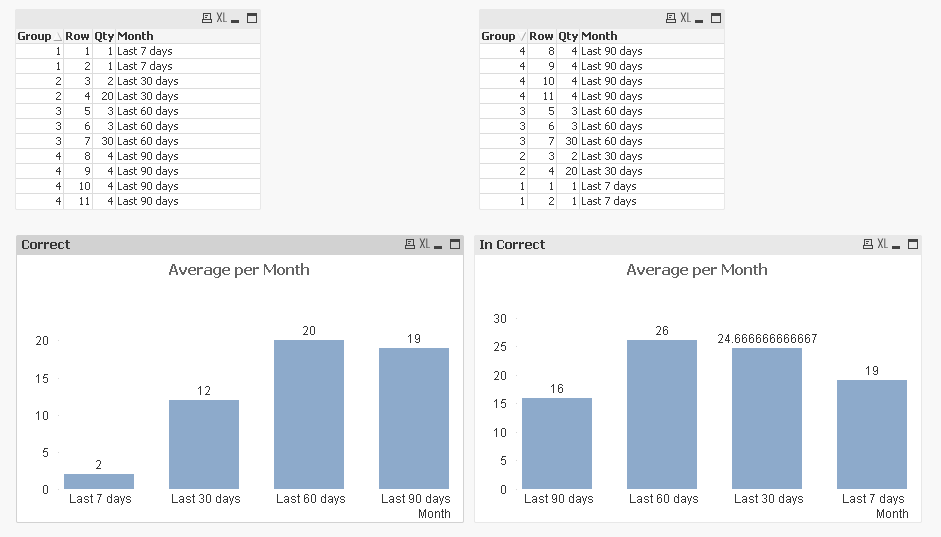
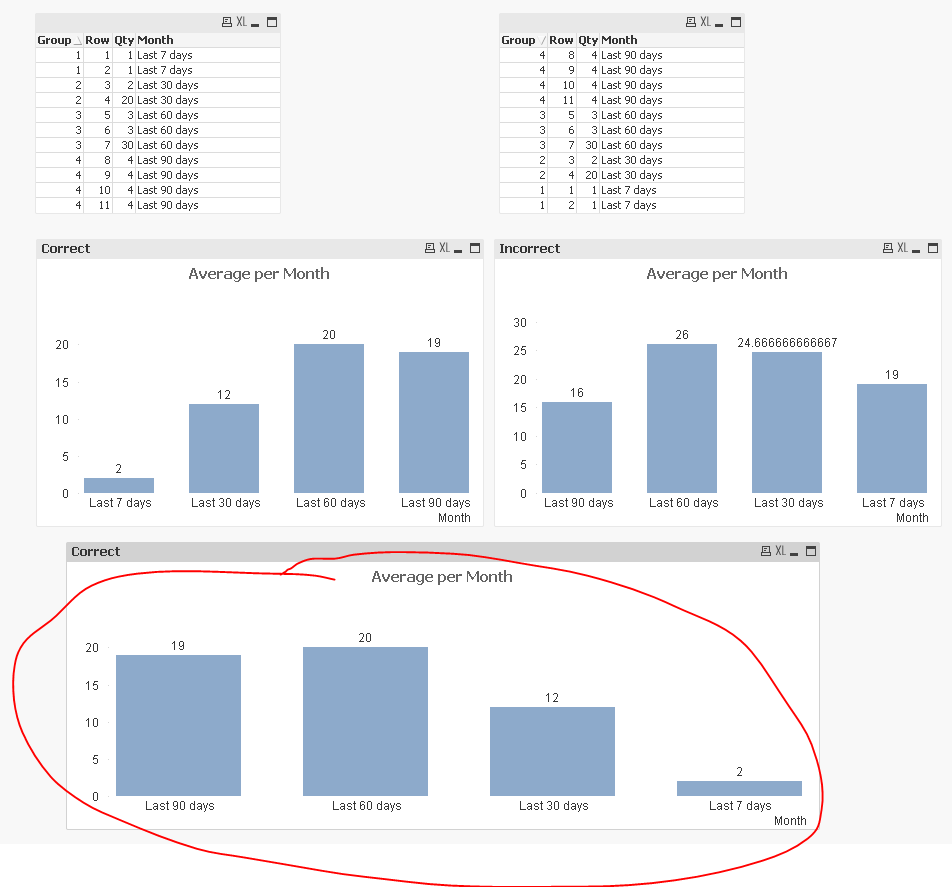
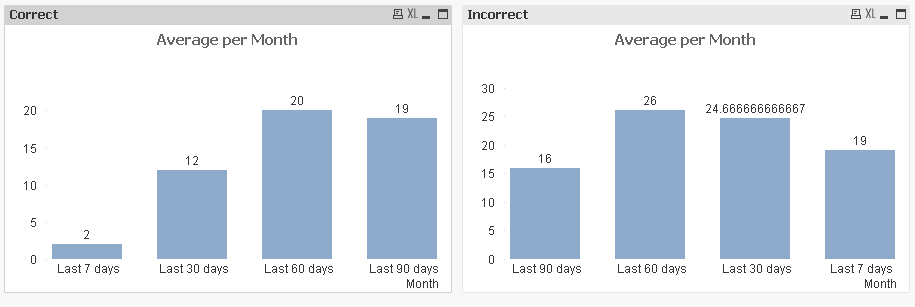
Here is what I'm trying to achive
I did it using barchart (Left graph) but when reversed dimension through sorting the values changed. How can I reverse dimension without changing the values?
- Mark as New
- Bookmark
- Subscribe
- Mute
- Subscribe to RSS Feed
- Permalink
- Report Inappropriate Content
Hi,Can you attach the sample data?
- Mark as New
- Bookmark
- Subscribe
- Mute
- Subscribe to RSS Feed
- Permalink
- Report Inappropriate Content
As long as your sort order is correct from the script..you can try this
Aggr(RangeAvg(Above(Sum({<[Group] = >}Qty), 0, RowNo())), Month)
Or you can use this approach if you have QV12 or above installed
- « Previous Replies
-
- 1
- 2
- Next Replies »