Unlock a world of possibilities! Login now and discover the exclusive benefits awaiting you.
- Qlik Community
- :
- Forums
- :
- Analytics
- :
- New to Qlik Analytics
- :
- Re: Use Total Function With Average And Aggr
- Subscribe to RSS Feed
- Mark Topic as New
- Mark Topic as Read
- Float this Topic for Current User
- Bookmark
- Subscribe
- Mute
- Printer Friendly Page
- Mark as New
- Bookmark
- Subscribe
- Mute
- Subscribe to RSS Feed
- Permalink
- Report Inappropriate Content
Use Total Function With Average And Aggr
Dear All,
Please help me to find a solution for the below :
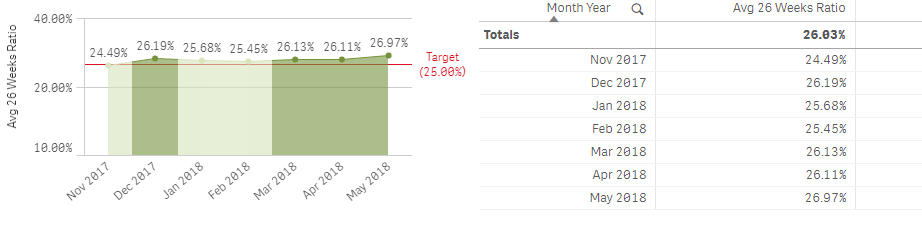
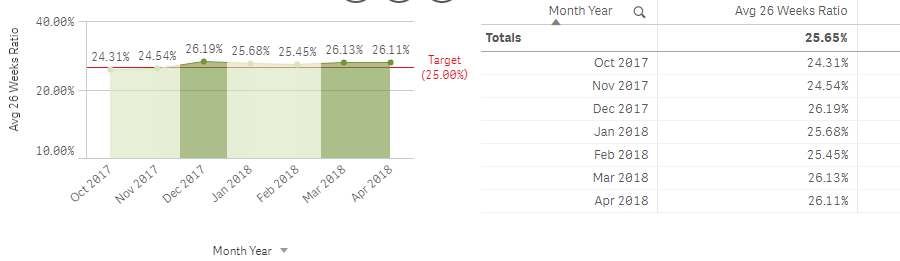
I Need to get the average Ratio of last 26 weeks for each month and show it on a Line Chart Trend as shown in the below Screens.
Instead of showing 26.97% I need to show 26.03 % for May 2018 (average 26 weeks)
Also
Instead of showing 26.11% I need to show 25.65 % for Apr 2018 (average 26 weeks)
And the same for the other months.
Expression :
avg({<Month = , Year = , [Month Year] = , [Week Year] = >}
aggr($(vNationalizationRatioLast26Weeks),Week , [Month Year],[Business Unit]))
Regards.
- « Previous Replies
-
- 1
- 2
- Next Replies »
- Mark as New
- Bookmark
- Subscribe
- Mute
- Subscribe to RSS Feed
- Permalink
- Report Inappropriate Content
Will it be possible to share a sample to look at this?
- Mark as New
- Bookmark
- Subscribe
- Mute
- Subscribe to RSS Feed
- Permalink
- Report Inappropriate Content
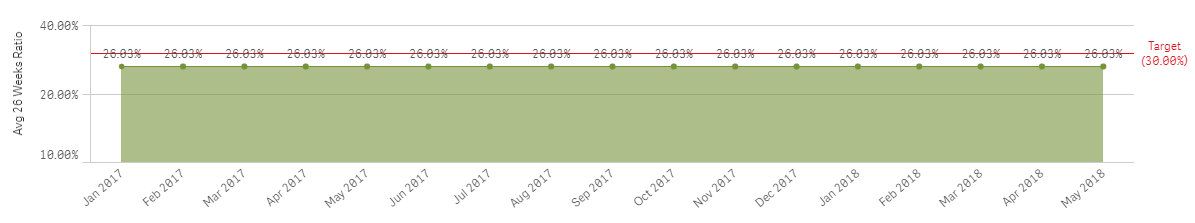
This is the expression i am using :
avg(TOTAL{<Month = , Year = , [Month Year] = , [Week Year] = >}
aggr($(vNationalizationRatioLast26Weeks),Week , [Month Year],[Business Unit]))
The above expression is giving the correct % for May which is 26.03% but it showing the same percentage for all the other months :S
What should I add to the Expression To get the same result gotten for May for the other Months ????
- Mark as New
- Bookmark
- Subscribe
- Mute
- Subscribe to RSS Feed
- Permalink
- Report Inappropriate Content
But isn't that what you wanted?
- Mark as New
- Bookmark
- Subscribe
- Mute
- Subscribe to RSS Feed
- Permalink
- Report Inappropriate Content
No I want to get the Average of Last 26 weeks for May which is showing now 26.03 %
And for April 2018 it should show 25.65 % which is the average of the last 26 weeks from April 2018.
It's complicated I know hope it's Clear now.
- Mark as New
- Bookmark
- Subscribe
- Mute
- Subscribe to RSS Feed
- Permalink
- Report Inappropriate Content
I suggest you to use The As-Of Table if you are able to make changes in the script. If not, then you will need Missing Manual - Above() and Below() functions to solve this. Set Analysis isn't going to work here....
- « Previous Replies
-
- 1
- 2
- Next Replies »