Unlock a world of possibilities! Login now and discover the exclusive benefits awaiting you.
- Qlik Community
- :
- Forums
- :
- Analytics
- :
- New to Qlik Analytics
- :
- Re: Help with graphing year-over-year % change (va...
- Subscribe to RSS Feed
- Mark Topic as New
- Mark Topic as Read
- Float this Topic for Current User
- Bookmark
- Subscribe
- Mute
- Printer Friendly Page
- Mark as New
- Bookmark
- Subscribe
- Mute
- Subscribe to RSS Feed
- Permalink
- Report Inappropriate Content
Help with graphing year-over-year % change (variance)
Hi,
I am trying to graph the year-over-year % change for a field called OperatingCost based on my dimension OperatingPeriod. I want a line graph showing the % change in OperatingCost for the past 5 years.
In my graph below, I have total OperatingCost displayed in a line graph based on the user selecting OperatingPeriod '805'. This is the current operating period. Last year's current operating period would be designated as '705'...
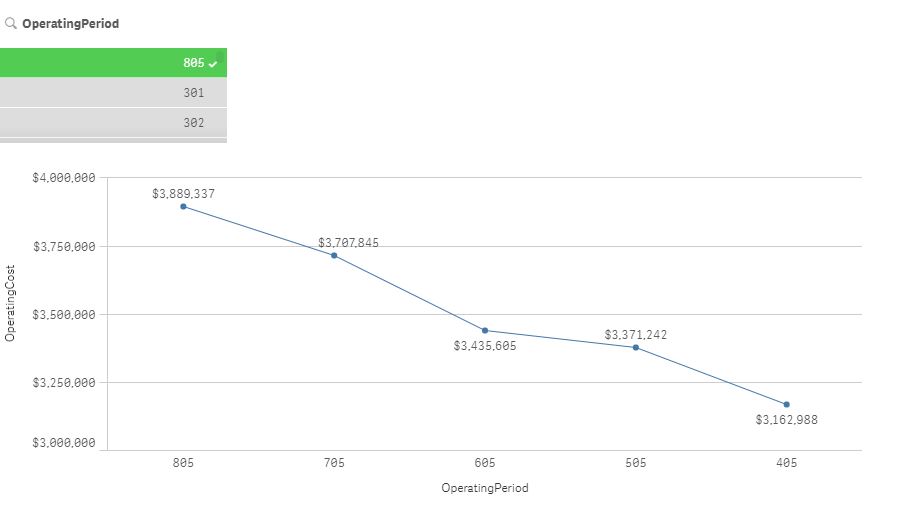
I am using set analysis so that I can visualize the OperatingCost for the past 5 years of the current period.
=Sum({$<OperatingPeriod = {$(=OperatingPeriod),$(=OperatingPeriod-100),$(=OperatingPeriod-200),$(=OperatingPeriod-300),$(=OperatingPeriod-400)}>}[OperatingCost])
I want to display the year-over-year % change (aka variance) instead of the total..... What would be the best way to do that?
For example, OperatingCost for OperatingPeriod '805' = $3,889,337
- OperatingCost for OperatingPeriod '705' = $3,707,845
/ OperatingCost for OperatingPeriod '705' = $3,707.845
= 4.89% increase
I want this % to be displayed for OperatingPeriod '805'. I'd like the function of my app to be dynamic so that the user could select an OpeartingPeriod and could see the past 5 years (year-over-year % changes).
I've tried a lot of different set analysis expressions but none have worked. Perhaps, I need to use an expression I'm not familiar with yet or do the math in the data load editor first? Would appreciate any suggestions.
Thanks,
Ross
Accepted Solutions
- Mark as New
- Bookmark
- Subscribe
- Mute
- Subscribe to RSS Feed
- Permalink
- Report Inappropriate Content
let's try using the below expression:
(
Sum( [OperatingCost] )
-
Sum( {< OperatingPeriod = {"=OperatingPeriod - 100"} >} TOTAL [OperatingCost] )
)
/
Sum( {< OperatingPeriod = {"=OperatingPeriod - 100"} >} TOTAL [OperatingCost] )
OR
(
Sum( [OperatingCost] )
-
Below( Column(1) )
)
/
Below( Column(1) )
sorting for OperatingPeriod numerically as descending
using a calculated dimension as below:
if( Match( OperatingPeriod, OperatingPeriod - 100, OperatingPeriod - 200, OperatingPeriod - 300, OperatingPeriod - 400 ) > 0, OperatingPeriod )
and tick suppress when value is null.
Hope it helps.
- Mark as New
- Bookmark
- Subscribe
- Mute
- Subscribe to RSS Feed
- Permalink
- Report Inappropriate Content
Hi,
I would have added a second dimension for year, which would take care of the problem of having everything add up to just one line since the expression would be separated over the second dimension.
Do you have a date field or anything connected to the data? If you do, the set-expression would be more easily managed;
Year = {">$(AddYears(Year(Today()),-5) <= $(Year(Today())"}
You can also change the Today() to Max(Year) if you want to be even more dynamic in selecting the start year from a list box.
- Mark as New
- Bookmark
- Subscribe
- Mute
- Subscribe to RSS Feed
- Permalink
- Report Inappropriate Content
let's try using the below expression:
(
Sum( [OperatingCost] )
-
Sum( {< OperatingPeriod = {"=OperatingPeriod - 100"} >} TOTAL [OperatingCost] )
)
/
Sum( {< OperatingPeriod = {"=OperatingPeriod - 100"} >} TOTAL [OperatingCost] )
OR
(
Sum( [OperatingCost] )
-
Below( Column(1) )
)
/
Below( Column(1) )
sorting for OperatingPeriod numerically as descending
using a calculated dimension as below:
if( Match( OperatingPeriod, OperatingPeriod - 100, OperatingPeriod - 200, OperatingPeriod - 300, OperatingPeriod - 400 ) > 0, OperatingPeriod )
and tick suppress when value is null.
Hope it helps.
- Mark as New
- Bookmark
- Subscribe
- Mute
- Subscribe to RSS Feed
- Permalink
- Report Inappropriate Content
I don't know if the ''Below' expression will work for me because my data is a compilation of individual lines of costs...something like this:
OperatingPeriod OperatingCost
805 $1,296,445
805 $648,222
805 $1,944,667
806 $1,690,545
806 $1,549,556
806 $64,456
807 $1,456,987
807 $45,282
807 $4,464
- Mark as New
- Bookmark
- Subscribe
- Mute
- Subscribe to RSS Feed
- Permalink
- Report Inappropriate Content
or
(
Sum( [OperatingCost] )
-
Sum( {< OperatingPeriod = {"=OperatingPeriod - 100"} >} TOTAL <OperatingPeriod> [OperatingCost] )
)
/
Sum( {< OperatingPeriod = {"=OperatingPeriod - 100"} >} TOTAL <OperatingPeriod> [OperatingCost] )
This would honor other filters set and just ignore OperatingPeriod, TOTAL is necessary to look "outside" the current set, in your graph that is OperatingPeriod
- Mark as New
- Bookmark
- Subscribe
- Mute
- Subscribe to RSS Feed
- Permalink
- Report Inappropriate Content
Great solution - Before, After, Above, Below etc work but not -100,-200. Looks like chart or pivot dimensions cannot be used as variables in set expressions. If I am incorrect, please comment. Thanks.