Unlock a world of possibilities! Login now and discover the exclusive benefits awaiting you.
- Qlik Community
- :
- Forums
- :
- Analytics
- :
- App Development
- :
- Re: heat map with pivot table
- Subscribe to RSS Feed
- Mark Topic as New
- Mark Topic as Read
- Float this Topic for Current User
- Bookmark
- Subscribe
- Mute
- Printer Friendly Page
- Mark as New
- Bookmark
- Subscribe
- Mute
- Subscribe to RSS Feed
- Permalink
- Report Inappropriate Content
heat map with pivot table
Hey There -
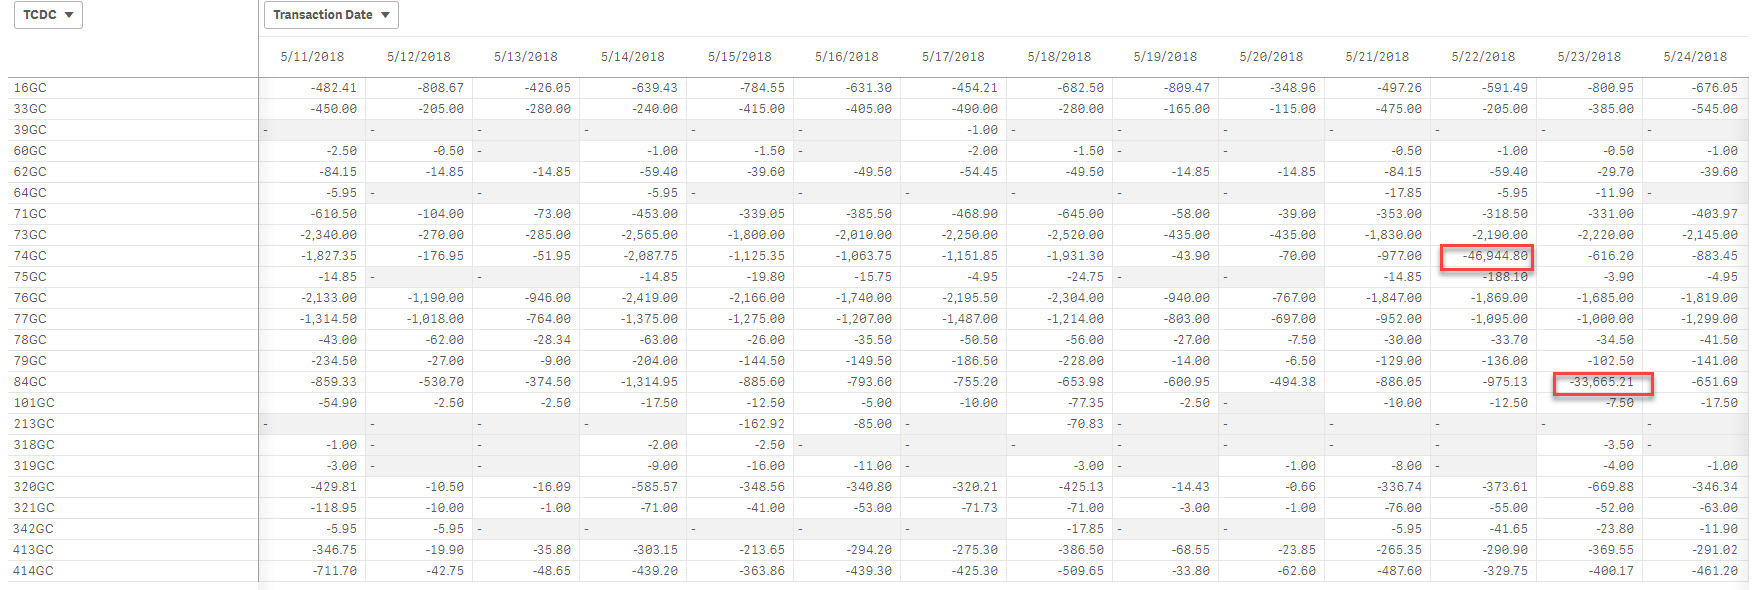
I have a pivot table with dates across the top (Transaction Date), codes (TCDC) down the side, and sum(Sum Amount) as the measure. I would like to apply a heat map to make is easy to identify when sum(Sum Amount) for a specific Transaction Date is unusual as compared to the rest Transaction Dates. I have highlighted two days in the attached screenshot that I want to jump out.
I suspect that colormix1 is the way to go, I just cant seem to figure it out.
- Mark as New
- Bookmark
- Subscribe
- Mute
- Subscribe to RSS Feed
- Permalink
- Report Inappropriate Content
Here's a good starting point: https://community.qlik.com/thread/200871
in your case, you'll have 2 dimensions in the AGGR() function (Transaction Date and TCDC)
look out for performance (with the number of possible dates...)
- Mark as New
- Bookmark
- Subscribe
- Mute
- Subscribe to RSS Feed
- Permalink
- Report Inappropriate Content
So if I just wanted to focus on the TCDC and ignore transaction date, would my function look something like this?
Colormix1((sum([Sum Amount])-$(=min(aggr( sum([Sum Amount]), TCDC)) ,blue(),green()))
- Mark as New
- Bookmark
- Subscribe
- Mute
- Subscribe to RSS Feed
- Permalink
- Report Inappropriate Content
nop. you need the second part as well.
Colormix1((sum([Sales])-$(=min(aggr( sum([Sales]), CategoryName))))/$(=(max(aggr( sum([Sales]),CategoryName))
-min(aggr( sum([Sales]), CategoryName)))),white(),$(vSalmon))
as the whole idea is to transform the range of your values to values between 0 and 1 as expected by the colormix1 function (colormix2 is -1 to 1 )
- Mark as New
- Bookmark
- Subscribe
- Mute
- Subscribe to RSS Feed
- Permalink
- Report Inappropriate Content
hmm I do have positive and negative values in my dataset, does that mean I should be using colormix2?
- Mark as New
- Bookmark
- Subscribe
- Mute
- Subscribe to RSS Feed
- Permalink
- Report Inappropriate Content
or download a qlikview version to use the colormix wizzard... (maybe one of the only things I'd still open a qlikview for) and copy paste results in QS 🙂
- Mark as New
- Bookmark
- Subscribe
- Mute
- Subscribe to RSS Feed
- Permalink
- Report Inappropriate Content
Hi
As colormix2 range the value between -1 an 0 , it accept 3 colors définitions in this order
Colormix2 (Value ,ColorMinusOne , ColorOne[ , ColorZero])
if you have negative values it may be sweetable to use colormix 2 rather than colormix1
- Mark as New
- Bookmark
- Subscribe
- Mute
- Subscribe to RSS Feed
- Permalink
- Report Inappropriate Content
Yikes - what came out of qlikview seems even more confusing and I didnt see a place in the wizard to add TCDC:
ColorMix1 ((1+Sign(2*(Sum ([$ Amount])-RangeMin (top(total Sum ([$ Amount]),1,NoOfRows(total))))/(RangeMax (top(total Sum ([$ Amount]),1,NoOfRows(total)))-RangeMin (top(total Sum ([$ Amount]),1,NoOfRows(total))))-1)*Sqrt(Fabs((2*(Sum ([$ Amount])-RangeMin (top(total Sum ([$ Amount]),1,NoOfRows(total))))/(RangeMax (top(total Sum ([$ Amount]),1,NoOfRows(total)))-RangeMin (top(total Sum ([$ Amount]),1,NoOfRows(total))))-1))))/2, ARGB(255, 255, 0, 0), ARGB(255, 0, 255, 0))
- Mark as New
- Bookmark
- Subscribe
- Mute
- Subscribe to RSS Feed
- Permalink
- Report Inappropriate Content
- Mark as New
- Bookmark
- Subscribe
- Mute
- Subscribe to RSS Feed
- Permalink
- Report Inappropriate Content
Was never able to get colormix to work, but found this extension that does exactly what I wanted::