Unlock a world of possibilities! Login now and discover the exclusive benefits awaiting you.
- Qlik Community
- :
- Forums
- :
- Analytics
- :
- New to Qlik Analytics
- :
- Re: Qlik Sense display two measures separately in ...
- Subscribe to RSS Feed
- Mark Topic as New
- Mark Topic as Read
- Float this Topic for Current User
- Bookmark
- Subscribe
- Mute
- Printer Friendly Page
- Mark as New
- Bookmark
- Subscribe
- Mute
- Subscribe to RSS Feed
- Permalink
- Report Inappropriate Content
Qlik Sense display two measures separately in a bar chart
Hi.
How to display two measures separately in a bar chart?
Now I trying make it in combo chart, but I can only separate measure when I use bar and line.
How can I make bar chart that display two scales right and left?
I use Qlik Sense version 12.5.
Is it became not able to separate measure?
Please advice.
Many thanks in advance.
- Tags:
- bar chat
- qlik sense
Accepted Solutions
- Mark as New
- Bookmark
- Subscribe
- Mute
- Subscribe to RSS Feed
- Permalink
- Report Inappropriate Content
You can't.
As you remarked, it could be possible only if you change the second measure aspect.. (line or symbol) instead of bar
- Mark as New
- Bookmark
- Subscribe
- Mute
- Subscribe to RSS Feed
- Permalink
- Report Inappropriate Content
Hi Buddy,
You can create it in Combo chart two measures one dimension
and make the one measure one as Primary axis
and another as on secondary axis (line/circle).
now the view will be like you wanted chart that display two scales right and left?
Hope this might helpful my friend...
Thanks
PM
- Mark as New
- Bookmark
- Subscribe
- Mute
- Subscribe to RSS Feed
- Permalink
- Report Inappropriate Content
You can't.
As you remarked, it could be possible only if you change the second measure aspect.. (line or symbol) instead of bar
- Mark as New
- Bookmark
- Subscribe
- Mute
- Subscribe to RSS Feed
- Permalink
- Report Inappropriate Content
Hi,
Please follow these steps:
- Use combochart, as Praveen suggests
- Add a dimension, that will be represent the horizontal axis
- Add a measure, that will represent the vertical axis
- Add a further measure, that will be on the same axis so far
- Change the type line or marker
- Go this second measure settings, and choose the secondary axis option.
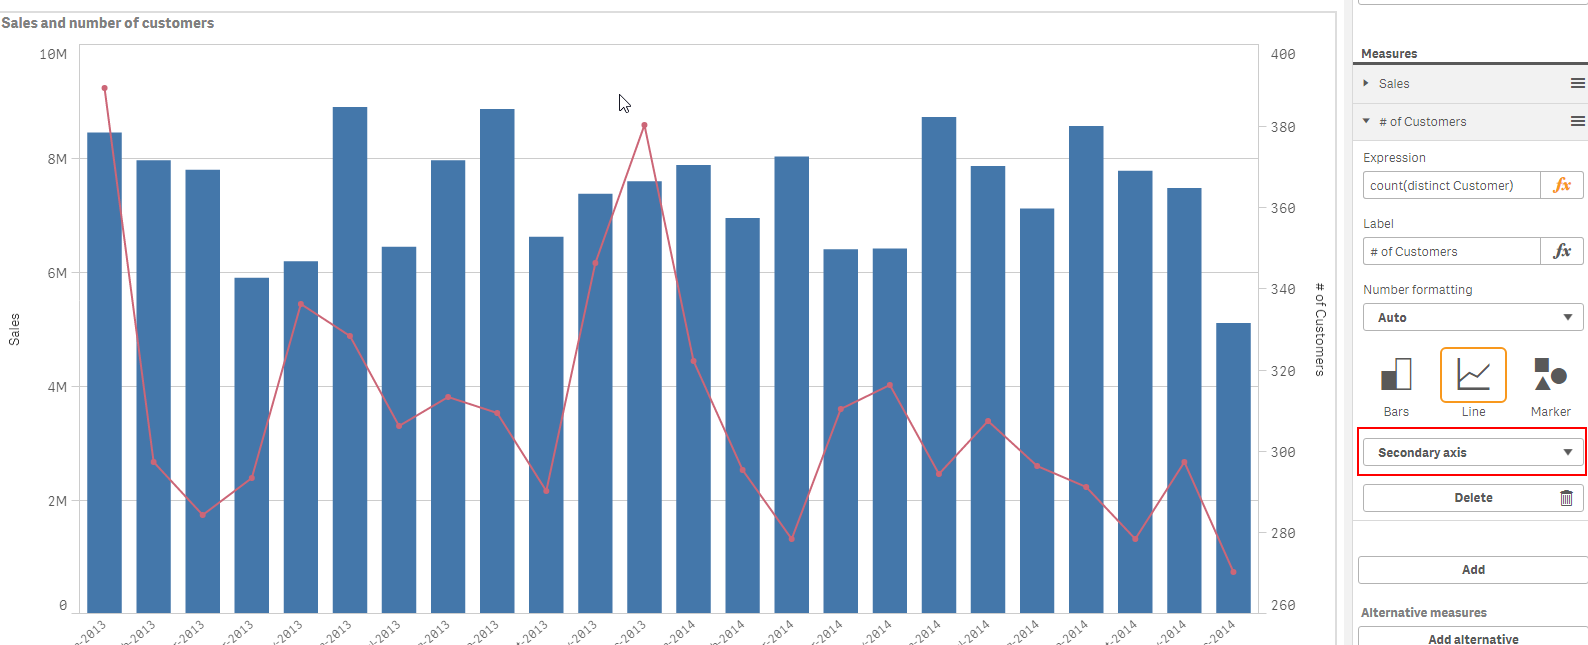
Conclusion:
With simple bar chart you can't achive it.
HTH
G.
- Mark as New
- Bookmark
- Subscribe
- Mute
- Subscribe to RSS Feed
- Permalink
- Report Inappropriate Content
Thank you very much for your reply.
I give up display two separete scale bar in combo chart.
I'll correspond to separate scale by using bar and line.
Thank you everyone for your response.