Unlock a world of possibilities! Login now and discover the exclusive benefits awaiting you.
- Qlik Community
- :
- Forums
- :
- Analytics
- :
- New to Qlik Analytics
- :
- Re: Warehouse layout with qlik sense
- Subscribe to RSS Feed
- Mark Topic as New
- Mark Topic as Read
- Float this Topic for Current User
- Bookmark
- Subscribe
- Mute
- Printer Friendly Page
- Mark as New
- Bookmark
- Subscribe
- Mute
- Subscribe to RSS Feed
- Permalink
- Report Inappropriate Content
Warehouse layout with qlik sense
Hello All,
I would like to create a layout of our warehouse shelfs and see green or red when the shelf is empty or not. The values will be 0 and 1. What we think is described below.
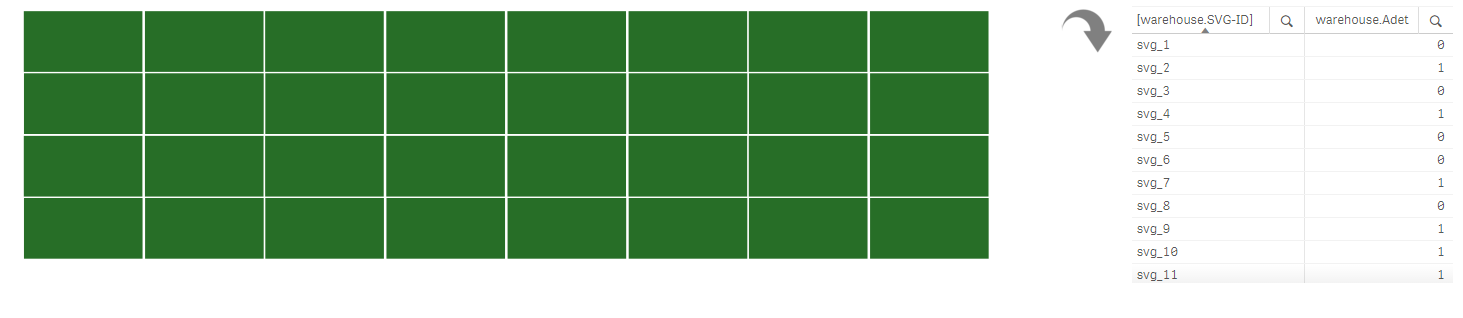
I created an svg file from a free website as in the picture below. This is the front view of our shelf 8 x 4. What we want here is, if the value is 0 in database (in this case the excel file), then the corresponding svg_id box must be green, if 1 then red. From this we will understand that the green shelfs are empty, red ones are filled. and later we will formulate the empty and filled shelfs to find out our ratio.
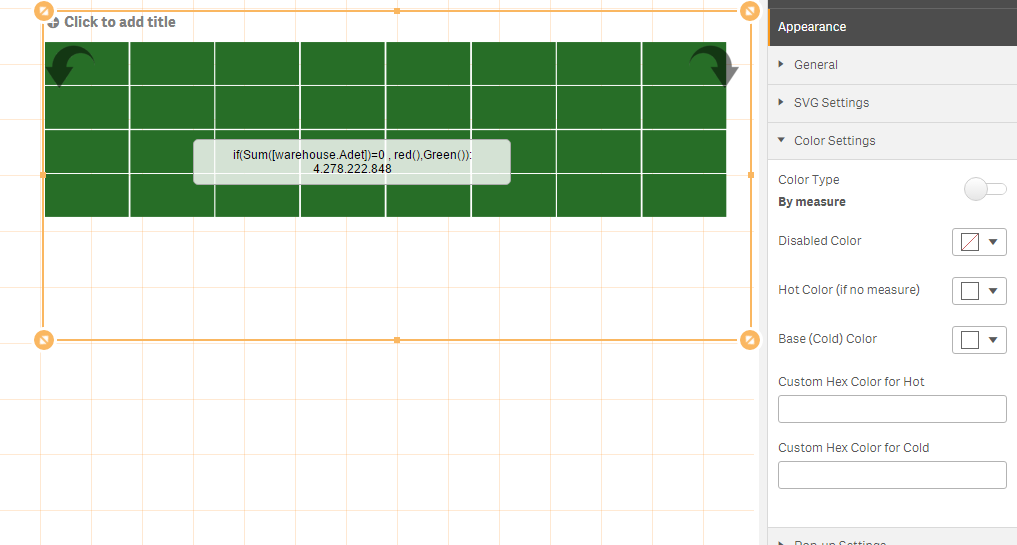
for this i am planning to use svg reader, which i did as in the picture above but the problem here is, i use the measure expression below
if(([warehouse.Adet])=0 ,Green() ,red())
and i see all green. The Colour function is wrong i think. Or maybe it is not supported with this extension.
If i change the colour property from svgreader extension as below, the the graphic corrupts.
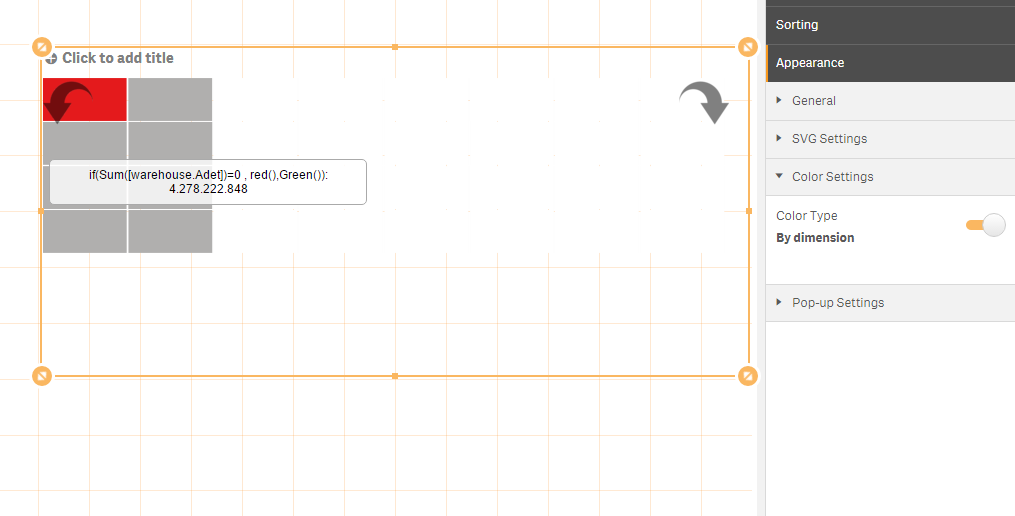
if i change it as below, then i cannot select either of the options like disabled color, hot color etc.....
My data excel is as follows with two columns
SVG-ID , Adet
svg_1 0
svg_2 1
svg_3 0
svg_4 1
svg_5 0
svg_6 0
svg_7 0
svg_8 1
svg_9 0
Can anyone help me with this.
Regards
- « Previous Replies
-
- 1
- 2
- Next Replies »
Accepted Solutions
- Mark as New
- Bookmark
- Subscribe
- Mute
- Subscribe to RSS Feed
- Permalink
- Report Inappropriate Content
With a Qlik Sense Pivot chart you can do this:
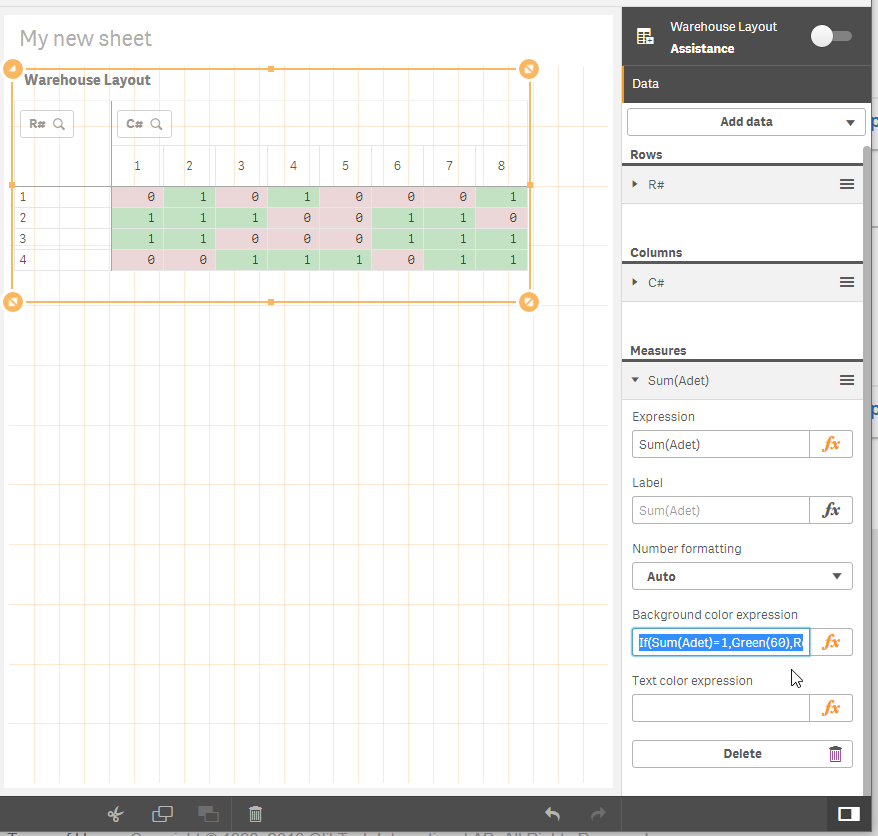
The "Background Color Expression" would be:
If(Sum(Adet)=1,Green(60),Red(40))
The load script to give the two dimensions C# and R# for a row and column number would look like this:
DATA:
LOAD
*,
Mod(ID-1,8)+1 AS C#,
Floor((ID-1)/8)+1 AS R#
INLINE [
ID , Adet
1,0
2,1
3,0
4,1
5,0
6,0
7,0
8,1
9,1
10,1
11,1
12,0
13,0
14,1
15,1
16,0
17,1
18,1
19,0
20,0
21,0
22,1
23,1
24,1
25,0
26,0
27,1
28,1
29,1
30,0
31,1
32,1
];
- Mark as New
- Bookmark
- Subscribe
- Mute
- Subscribe to RSS Feed
- Permalink
- Report Inappropriate Content
You should be able to use regular table to achieve this. It seems to be overkill to use an SVG-extension if it is only the background color you want to change.
- Mark as New
- Bookmark
- Subscribe
- Mute
- Subscribe to RSS Feed
- Permalink
- Report Inappropriate Content
With a Qlik Sense Pivot chart you can do this:
The "Background Color Expression" would be:
If(Sum(Adet)=1,Green(60),Red(40))
The load script to give the two dimensions C# and R# for a row and column number would look like this:
DATA:
LOAD
*,
Mod(ID-1,8)+1 AS C#,
Floor((ID-1)/8)+1 AS R#
INLINE [
ID , Adet
1,0
2,1
3,0
4,1
5,0
6,0
7,0
8,1
9,1
10,1
11,1
12,0
13,0
14,1
15,1
16,0
17,1
18,1
19,0
20,0
21,0
22,1
23,1
24,1
25,0
26,0
27,1
28,1
29,1
30,0
31,1
32,1
];
- Mark as New
- Bookmark
- Subscribe
- Mute
- Subscribe to RSS Feed
- Permalink
- Report Inappropriate Content
thanks,
this look simple and lean for me but, for the workers it should be more visual, that's why i was trying to use the extension. There are more than 100 shelf's like this and we will need a lot of from this table. The user will everytime change the value if the shelf is loaded, later the automatisation will follow, which there will be sensors on the shelfs, that will send 0 and 1 to the database.
This was just a brainstorming result. We 'll see what we can do.
I'll try to make the staff accept this, if i cant find a solution with the extension and make it simple.
- Mark as New
- Bookmark
- Subscribe
- Mute
- Subscribe to RSS Feed
- Permalink
- Report Inappropriate Content
It would be easy to extend it into more shelves. Explain more about how you want it displayed and maybe we can come up with a good solution for you. What more do you expect the SVG-solution to visualize?
- Mark as New
- Bookmark
- Subscribe
- Mute
- Subscribe to RSS Feed
- Permalink
- Report Inappropriate Content
this is the top view of one warehouse area. We will need a front view for every set of 8x4 shelfs. And the data here will be entered using excel(from database in the future). Then when i open the app at qlik sense i'll use update button to fetch new data and change visual.
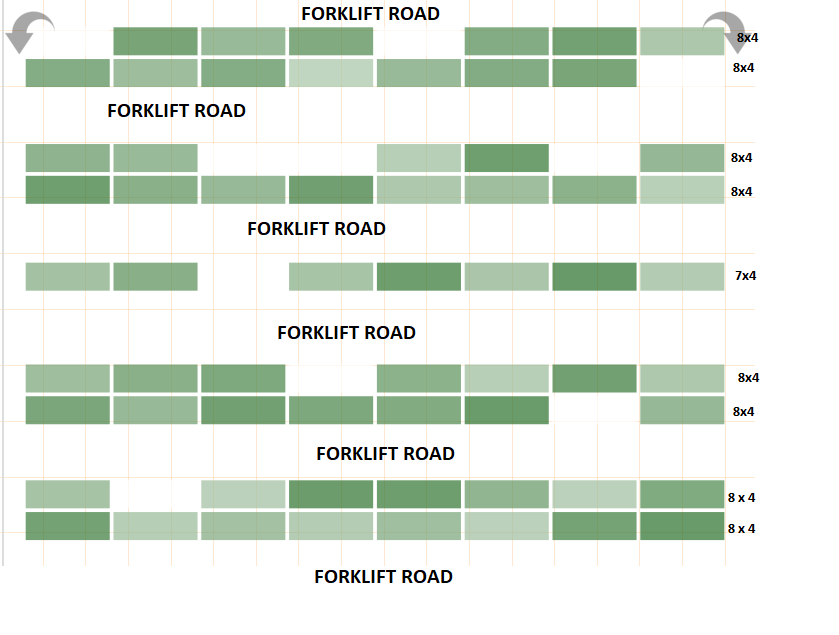
the thing with the svg extension is, every square has an id like " svgid_1" in our example. But in reality the shelfs has their own uniqe id's in the database which i have no access now. The reason i wanted to use svg reader is i will try to match the real id of the shelf with the right square on the screen and use color function. Actually It would be better not to use the extension, but it seemed simple to make at first glance.
- Mark as New
- Bookmark
- Subscribe
- Mute
- Subscribe to RSS Feed
- Permalink
- Report Inappropriate Content
You have more than two colors in the grid - is that what you want?
- Mark as New
- Bookmark
- Subscribe
- Mute
- Subscribe to RSS Feed
- Permalink
- Report Inappropriate Content
no, sorry i couldnt change the graident color for this picture. main colours will be green for empty and red for not empty
- Mark as New
- Bookmark
- Subscribe
- Mute
- Subscribe to RSS Feed
- Permalink
- Report Inappropriate Content
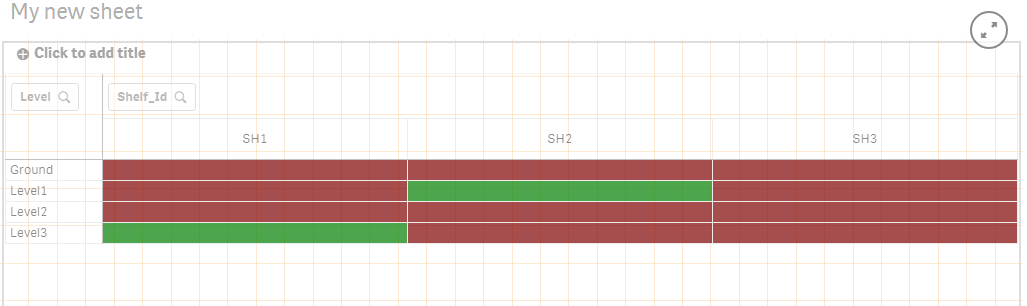
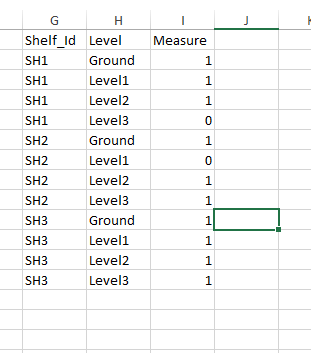
i did this but i have to put all the shelfs near each other as a column
the excel would be like this
- Mark as New
- Bookmark
- Subscribe
- Mute
- Subscribe to RSS Feed
- Permalink
- Report Inappropriate Content
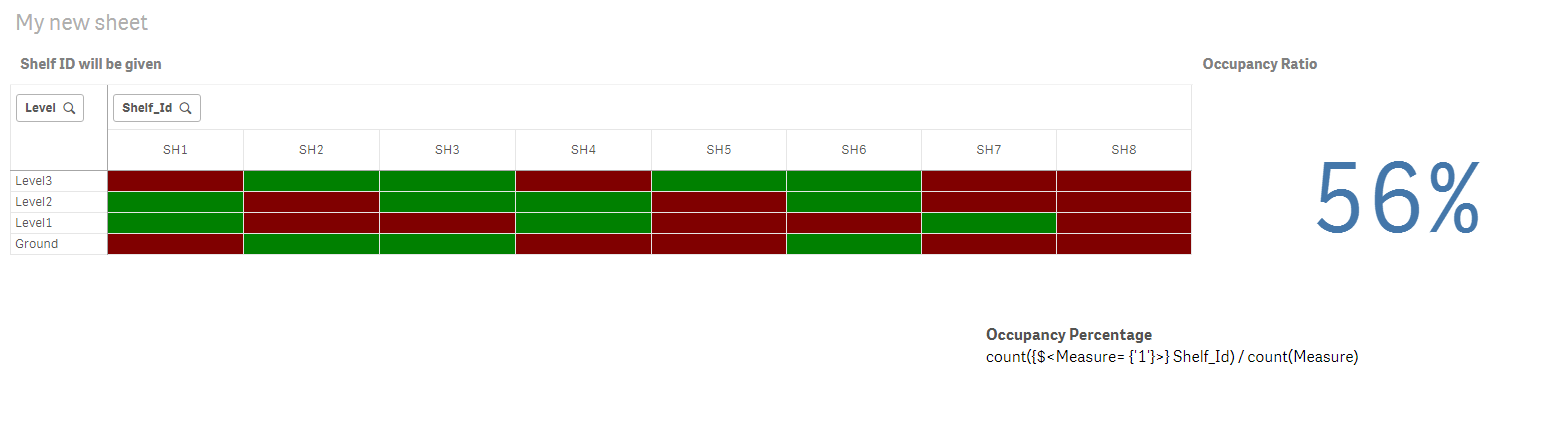
hello i managed to do something like this,from your replies
- « Previous Replies
-
- 1
- 2
- Next Replies »