Unlock a world of possibilities! Login now and discover the exclusive benefits awaiting you.
- Qlik Community
- :
- All Forums
- :
- QlikView App Dev
- :
- Re: Forecasting with selections
- Subscribe to RSS Feed
- Mark Topic as New
- Mark Topic as Read
- Float this Topic for Current User
- Bookmark
- Subscribe
- Mute
- Printer Friendly Page
- Mark as New
- Bookmark
- Subscribe
- Mute
- Subscribe to RSS Feed
- Permalink
- Report Inappropriate Content
Forecasting with selections
Hi,
I have a table with field:
Date,
Enrollment Count,
State,
Tehsil
and some more fields...
A state has one or more tehsil in it.
So a sample data would look like
Date Enrollment Count State Tehsil
01/09/2011 12 X a
?01/09/2011 13 X b
01/09/2011 11 Y c
01/09/2011 19 Y d
02/09/2011 15 X a
02/09/2011 17 X b
02/09/2011 13 Y c
02/09/2011 14 Y d.
This goes on....
Wish 1:
I would like to plot a chart with x axis as date, y axis as sum of enrollment count. For dates which the data exist, it should give the actual values. For future dates, it should forecast the values. The forecast can be a regression line, or an average of the last fifteen days.
Wish 2:
I have a list box, which would enlist the state. If I select a particular state(say X), then the above chart should reflect the actual and forecast data for that particular state.
Similarly, I have a list box which enlists the tehsil. I should be able to select a particular tehsil and get its corresponding actual and forecast data.
Any help/suggestions would be appreciated.
Regards,
Rajiv
- « Previous Replies
-
- 1
- 2
- Next Replies »
- Mark as New
- Bookmark
- Subscribe
- Mute
- Subscribe to RSS Feed
- Permalink
- Report Inappropriate Content
Ok, thanks. Here it is.
- Mark as New
- Bookmark
- Subscribe
- Mute
- Subscribe to RSS Feed
- Permalink
- Report Inappropriate Content
Hi Robert,
Thanks for taking time out and building the application. I just had a quick glance at it(lots of office work currently) and it looks to work.
Will go through the solution once I am little more free.
Thanks again. I'm sure it ll be of help
Cheers,
Rajiv
- Mark as New
- Bookmark
- Subscribe
- Mute
- Subscribe to RSS Feed
- Permalink
- Report Inappropriate Content
Hi Robert
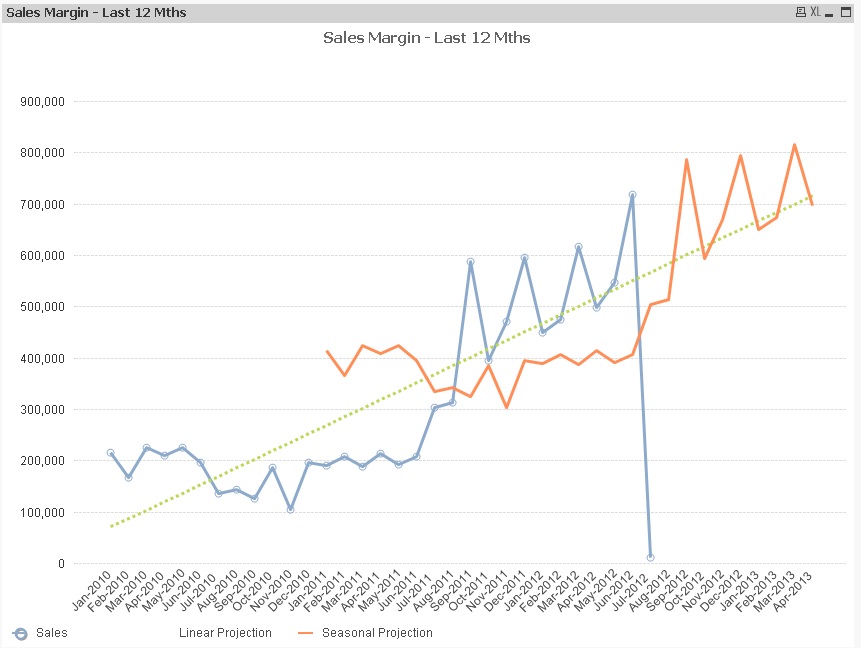
Thanks for the great example. I have applied this to the projections section of a How To app I am working on. I added another expression to show the forecast adjusted for the deviation from the linear progression from 12 months ago. This essentially takes into account monthly seasonality, albeit using only the months in the prior year as the source of the seasonality. The app is attached if anyone is interested and a screen shot is below.
Although this is just sample data, it somewhat highlights how simple statistical calculations do not result in useful forecasts - there are too many other factors that need to be considered as impacting the results from year to year. It would be nice to do a formula that averaged the deviation across multiple years....but I think as time passes the older data becomes less and less relevant. So such analysis would be mostly of academic interest rather than of much use in a business scenario.
For anyone interested in doing forecasts like this, note the extra work I did in the masterCalendar:
- Add extra future periods to your calendar to allow you to forecast forward
- Add some sort of flag to highlight the periods that are future periods. This allows you to use set analysis to isolate the values you want to calculate the linear progression from, (otherwise the future months with zero sales seem to get included in the calcs and the forcast line is distorted). I made sure the current month was treated as a forecast month so that the incomplete sales data is ignored for the calculations.
- « Previous Replies
-
- 1
- 2
- Next Replies »