Unlock a world of possibilities! Login now and discover the exclusive benefits awaiting you.
Announcements
Live today at 11 AM ET. Get your questions about Qlik Connect answered, or just listen in.
SIGN UP NOW
- Qlik Community
- :
- Forums
- :
- Analytics
- :
- New to Qlik Analytics
- :
- Re: 100% Stacked Bar Chart
Options
- Subscribe to RSS Feed
- Mark Topic as New
- Mark Topic as Read
- Float this Topic for Current User
- Bookmark
- Subscribe
- Mute
- Printer Friendly Page
Turn on suggestions
Auto-suggest helps you quickly narrow down your search results by suggesting possible matches as you type.
Showing results for
Contributor III
2018-06-11
02:59 PM
- Mark as New
- Bookmark
- Subscribe
- Mute
- Subscribe to RSS Feed
- Permalink
- Report Inappropriate Content
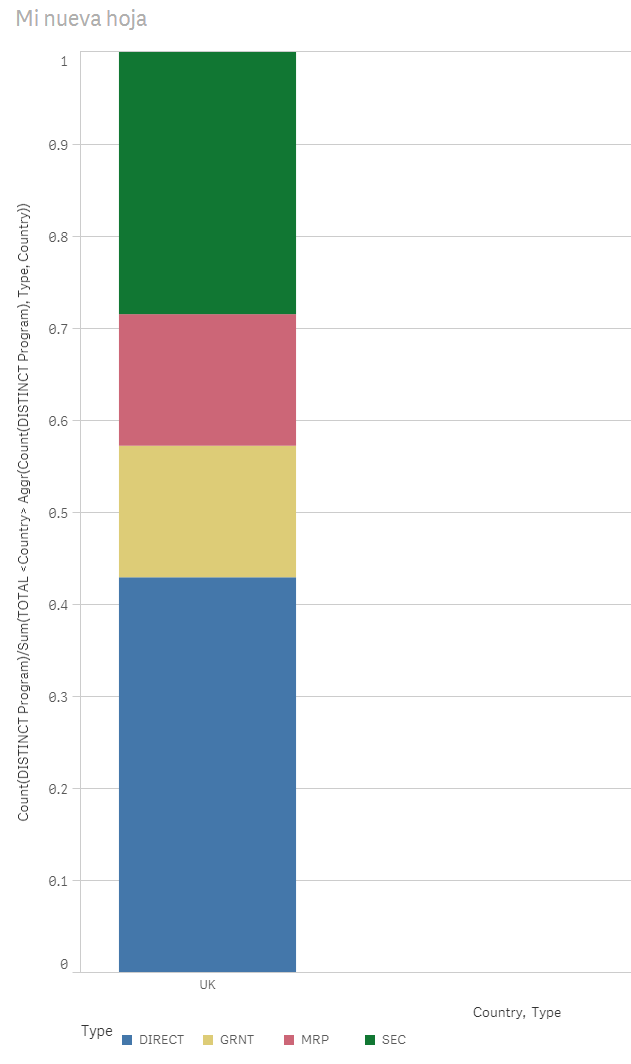
100% Stacked Bar Chart
Hi,
I need to build an Stacked Bar Chart where all bars sum 100%.
One dimention is Country and the other one is Type and the expresion its a count of Program.
The problem is with the denominator for the percentage because a program can be repeated for the same country and type since it can have different products
I tried with
COUNT (TOTAL <Country> Program)
AGGR(nodistinct COUNT(Program), Country)
| Program | Type | Country | Product |
| P1 | DIRECT | UK | PTE |
| P1 | DIRECT | UK | KMG |
| P2 | DIRECT | UK | ASD |
| P2 | DIRECT | UK | PYU |
| P2 | DIRECT | UK | KMG |
| P2 | SEC | UK | PTE |
| P3 | GRNT | UK | PYU |
| P3 | GRNT | UK | ASD |
| P3 | GRNT | UK | KMG |
| P3 | DIRECT | UK | KMG |
| P3 | MRP | UK | PTE |
| P3 | MRP | UK | KMG |
| P3 | SEC | UK | PYU |
I attached the qvf and the excel with the graph that should be shown.
Thanks in advanced.
397 Views
1 Reply
MVP
2018-06-11
03:14 PM
- Mark as New
- Bookmark
- Subscribe
- Mute
- Subscribe to RSS Feed
- Permalink
- Report Inappropriate Content
Try this
Count(DISTINCT Program)/Sum(TOTAL <Country> Aggr(Count(DISTINCT Program), Type, Country))
355 Views
Community Browser