Unlock a world of possibilities! Login now and discover the exclusive benefits awaiting you.
- Qlik Community
- :
- Forums
- :
- Analytics
- :
- App Development
- :
- Re: Graph of future sales forecast based on histor...
- Subscribe to RSS Feed
- Mark Topic as New
- Mark Topic as Read
- Float this Topic for Current User
- Bookmark
- Subscribe
- Mute
- Printer Friendly Page
- Mark as New
- Bookmark
- Subscribe
- Mute
- Subscribe to RSS Feed
- Permalink
- Report Inappropriate Content
Graph of future sales forecast based on historical QlikSense
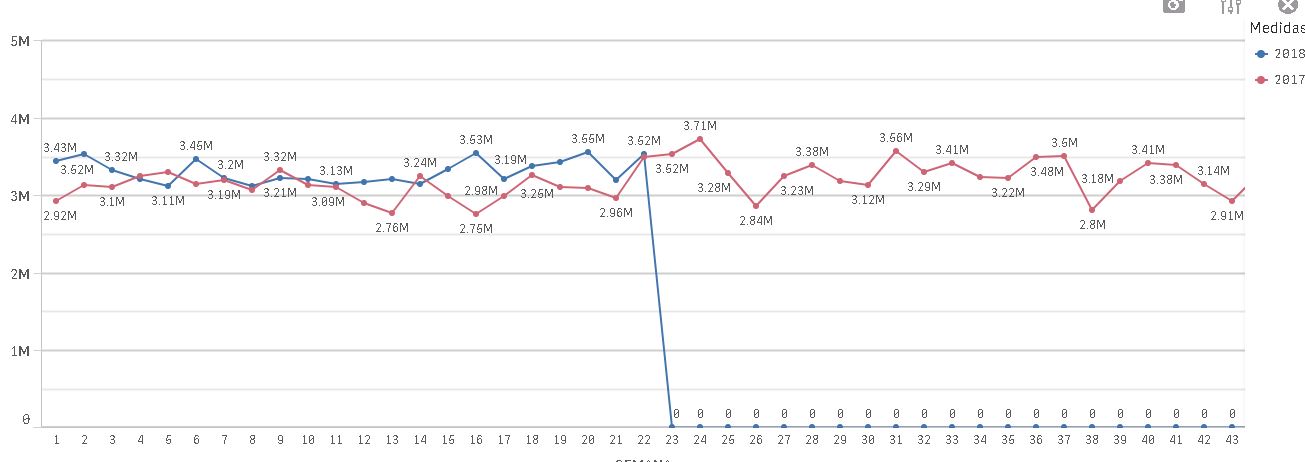
Hello, I request your kind support to create in QLIKSENSE a trend graph (or forecast) of sales based on the weekly sale of the previous weeks of 2018, the graph I have is the following and what I do not want is to see that drop to zero in the following weeks, if not rather a forecast that is made based on the average of the previous weeks.
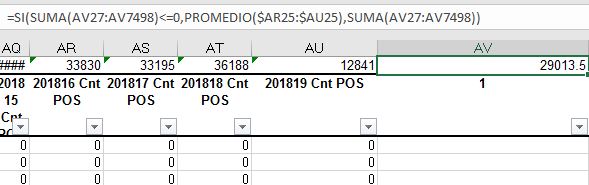
In excel you get with this formula
= YES (SUM (AV27: AV7498) <= 0, AVERAGE ($ AR25: $ AU25), SUM (AV27: AV7498))
In Qlik Sense I do not have how to assign that value in that way because obviously I do not have data loaded for future weeks ...
I hope you have explained me well and that someone can guide me.
Thank you very much.
- Mark as New
- Bookmark
- Subscribe
- Mute
- Subscribe to RSS Feed
- Permalink
- Report Inappropriate Content
Hi,
what's the rule/formula for forecast in english (we hav'nt values of what are meaning cells) ?
regards
- Mark as New
- Bookmark
- Subscribe
- Mute
- Subscribe to RSS Feed
- Permalink
- Report Inappropriate Content
PFA attached sample.
Vikas
If the issue is solved please mark the answer with Accept as Solution & like it.
If you want to go quickly, go alone. If you want to go far, go together.
- Mark as New
- Bookmark
- Subscribe
- Mute
- Subscribe to RSS Feed
- Permalink
- Report Inappropriate Content
I don't see attachement !
- Mark as New
- Bookmark
- Subscribe
- Mute
- Subscribe to RSS Feed
- Permalink
- Report Inappropriate Content
Thanks for reply Olivier, what I need Is the same that I show you below, the formula (in english) in Excel is:
=IF(SUM(AV27:AV7498)<=0,AVG($AR25:$AU25),SUM(AV27:AV7498))
and the graphic that I need is like this :
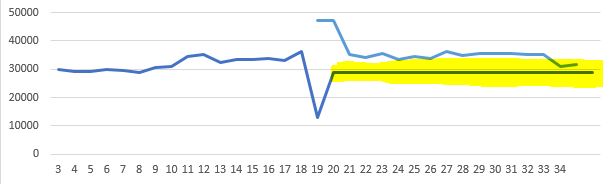
What I need to do in QLikSense is the values in the line marked in yellow ( is the forecast).
My example in excel is like this:
I hope I have explained yo well...
Thanks a lot 