Unlock a world of possibilities! Login now and discover the exclusive benefits awaiting you.
- Qlik Community
- :
- Forums
- :
- Analytics
- :
- New to Qlik Analytics
- :
- Re: How to create filter/dimension to display reco...
- Subscribe to RSS Feed
- Mark Topic as New
- Mark Topic as Read
- Float this Topic for Current User
- Bookmark
- Subscribe
- Mute
- Printer Friendly Page
- Mark as New
- Bookmark
- Subscribe
- Mute
- Subscribe to RSS Feed
- Permalink
- Report Inappropriate Content
How to create filter/dimension to display records based on conditions on aggregated summary tables
Dear all,
I am trying to see what is the best way i can replicate the analysis i have done on excel onto Qlik sense desktop. Attached excel will show the steps i have taken to arrive at the table view i would like to achieve after applying a set of conditions on the pivot table. (QVF attached with what i had attempted as well)
Snapshot of the raw data used:
| PO Number | PO Item | Vendor | Buyer | Amount | MonthYear |
| PO1 | 1 | Vendor 1 | Buyer A | 50 | Jun-18 |
| PO1 | 2 | Vendor 1 | Buyer A | 30 | Jun-18 |
| PO1 | 3 | Vendor 1 | Buyer A | 20 | Jun-18 |
| PO1 | 4 | Vendor 1 | Buyer A | 10 | Jun-18 |
| PO1 | 5 | Vendor 1 | Buyer A | 10 | Jun-18 |
| PO1 | 6 | Vendor 1 | Buyer A | 30 | Jun-18 |
| PO2 | 1 | Vendor 1 | Buyer B | 200 | Jun-18 |
| PO2 | 2 | Vendor 1 | Buyer B | 200 | Jun-18 |
| PO2 | 3 | Vendor 1 | Buyer B | 100 | Jun-18 |
| PO3 | 1 | Vendor 2 | Buyer A | 50 | Jun-18 |
| PO3 | 2 | Vendor 2 | Buyer A | 50 | Jun-18 |
| PO3 | 3 | Vendor 2 | Buyer A | 50 | Jun-18 |
| PO3 | 4 | Vendor 2 | Buyer A | 50 | Jun-18 |
What i would like to achieve is first aggregate the data to find the sum amount per Vendor per Buyer as well as avg PO amount per vendor per vendor
Then, applying a condition of sum amount per vendor per buyer >=150 and avg amount per vendor per buyer <= 150 to display the list of vendor buyer records fulfilling both conditions.
I managed to do aggregation of Sum and Avg as measures in pivot table on QS. While I tried to create a filter/dimension(flag) on master dimension, it does not seem to be working (differ from the results i have on excel model) Hence, i appreciate your help on how to set up a flag to be able to identify them when i need to
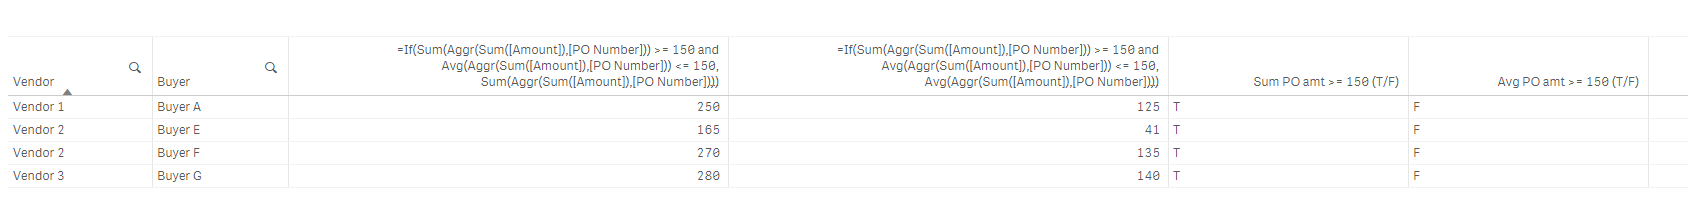
Desired table out put when selecting an option to apply conditions.
| MonthYear | 1/6/2018 | To display table with Sum Amt >= 150 and Avg Amt <=150 | |||
| 150 | 150 | ||||
| Vendor | Buyer | Avg Amt | Sum Amt | Avg PO amt >= 150 (T/F) | Sum PO amt >= 150 (T/F) |
| Vendor 1 | Buyer A | 125 | 250 | F | T |
| Vendor 2 | Buyer E | 41 | 165 | F | T |
| Vendor 2 | Buyer F | 135 | 270 | F | T |
| Vendor 3 | Buyer G | 140 | 280 | F | T |
Many thanks in advance and looking forward to learn from all of you.:)
Best,
Eng Xiong
- Mark as New
- Bookmark
- Subscribe
- Mute
- Subscribe to RSS Feed
- Permalink
- Report Inappropriate Content
Something like this?
- Mark as New
- Bookmark
- Subscribe
- Mute
- Subscribe to RSS Feed
- Permalink
- Report Inappropriate Content
Hi Sunny,
Thanks for the tips. Yes, this is helpful to me in creating the static tables:) However, do you see a possibility in creating a flag / master dimension which i can easily use it in other tables and charts? I was thinking with that i should be able to compare the data sets between those with and without the conditions - which i had attempted to create the flag as master dimensions but without success.
Meanwhile, i will explore using variables in the expressions you provided to create the flexibility for users to conduct scenario tests.
Million thanks again!
Best,
Eng Xiong