Unlock a world of possibilities! Login now and discover the exclusive benefits awaiting you.
- Qlik Community
- :
- All Forums
- :
- Qlik NPrinting
- :
- Re: NPrinting 17 - pixel perfect levels
- Subscribe to RSS Feed
- Mark Topic as New
- Mark Topic as Read
- Float this Topic for Current User
- Bookmark
- Subscribe
- Mute
- Printer Friendly Page
- Mark as New
- Bookmark
- Subscribe
- Mute
- Subscribe to RSS Feed
- Permalink
- Report Inappropriate Content
NPrinting 17 - pixel perfect levels
I'm wondering if someone can explain the different use cases when one would use chart objects as levels vs. use individual fields as levels. Is there even any difference in how you go about it? Thanks.
- « Previous Replies
-
- 1
- 2
- Next Replies »
Accepted Solutions
- Mark as New
- Bookmark
- Subscribe
- Mute
- Subscribe to RSS Feed
- Permalink
- Report Inappropriate Content
Hi Kris,
First of all I would to suggest you to refer to the official PixelPerfect documentation in the help site PixelPerfect reports ‒ Qlik NPrinting. There are examples of using Levels in PixelPerfect repots in both cases, with single field and with straight tables.
If you want to add a table into a PixelPerfect template you have two possibilities.
You can add the original table into the Images node. This will produce and image in the final report. Report production time is faster and recipients have no access to the original numbers, they need to manually copy them. A cons, for example, is that you cannot add calculated columns.
The second solution is to add the orginal table in the template Tables node and rebuid it into the template as showed in Creating a simple PixelPerfect report ‒ Qlik NPrinting. Report production time will be a bit slower than with images, but you have a full control of the table formats and you can add calulated column, total, subtotals etc.
You can add a single field in the Levels node for example when you wan to produce the same table but repeated once for each value of the field you added in the Levels node. For example if you want to print the same table once for each Year, you add the Year field in the Levels node and after you nested the table inside. See Creating PixelPerfect reports with a level ‒ Qlik NPrinting
In Qlik NPrinting you can create nested levles and inside a level you can place different objects, for example many images.
Best,
Ruggero
Best Regards,
Ruggero
---------------------------------------------
When applicable please mark the appropriate replies as CORRECT. This will help community members and Qlik Employees know which discussions have already been addressed and have a possible known solution. Please mark threads with a LIKE if the provided solution is helpful to the problem, but does not necessarily solve the indicated problem. You can mark multiple threads with LIKEs if you feel additional info is useful to others.
- Mark as New
- Bookmark
- Subscribe
- Mute
- Subscribe to RSS Feed
- Permalink
- Report Inappropriate Content
Is this is your expectation:
Add a GroupHeader band for each DetailReport and place labels in there.

Tip: RMB on selected field names to drag them in as labels

You will get output something like this

- Mark as New
- Bookmark
- Subscribe
- Mute
- Subscribe to RSS Feed
- Permalink
- Report Inappropriate Content
- Mark as New
- Bookmark
- Subscribe
- Mute
- Subscribe to RSS Feed
- Permalink
- Report Inappropriate Content
Thanks for the info but it's still a bit vague for me. I guess I'm still left wondering when or why would one use individual fields as "Add Levels" vs the method you showed (use chart objects as levels)? What are reasons one would use one method vs the other? Is the difference the "sub level" concept you get with individual fields as your levels, and if so, what do you gain from that...is is more than just a formatting or "look and feel" that is achieved? Thanks.
- Mark as New
- Bookmark
- Subscribe
- Mute
- Subscribe to RSS Feed
- Permalink
- Report Inappropriate Content
Hi Kris,
First of all I would to suggest you to refer to the official PixelPerfect documentation in the help site PixelPerfect reports ‒ Qlik NPrinting. There are examples of using Levels in PixelPerfect repots in both cases, with single field and with straight tables.
If you want to add a table into a PixelPerfect template you have two possibilities.
You can add the original table into the Images node. This will produce and image in the final report. Report production time is faster and recipients have no access to the original numbers, they need to manually copy them. A cons, for example, is that you cannot add calculated columns.
The second solution is to add the orginal table in the template Tables node and rebuid it into the template as showed in Creating a simple PixelPerfect report ‒ Qlik NPrinting. Report production time will be a bit slower than with images, but you have a full control of the table formats and you can add calulated column, total, subtotals etc.
You can add a single field in the Levels node for example when you wan to produce the same table but repeated once for each value of the field you added in the Levels node. For example if you want to print the same table once for each Year, you add the Year field in the Levels node and after you nested the table inside. See Creating PixelPerfect reports with a level ‒ Qlik NPrinting
In Qlik NPrinting you can create nested levles and inside a level you can place different objects, for example many images.
Best,
Ruggero
Best Regards,
Ruggero
---------------------------------------------
When applicable please mark the appropriate replies as CORRECT. This will help community members and Qlik Employees know which discussions have already been addressed and have a possible known solution. Please mark threads with a LIKE if the provided solution is helpful to the problem, but does not necessarily solve the indicated problem. You can mark multiple threads with LIKEs if you feel additional info is useful to others.
- Mark as New
- Bookmark
- Subscribe
- Mute
- Subscribe to RSS Feed
- Permalink
- Report Inappropriate Content
Thanks. I've reread the online help and it's a bit more clear. I think I'll have to first find out what our report requirements are and then experiment from there to achieve the right result.
- Mark as New
- Bookmark
- Subscribe
- Mute
- Subscribe to RSS Feed
- Permalink
- Report Inappropriate Content
Hi,
If I want to put a chart on the right of the table, how I can do it? Is it possible?
I want to have this result:

Thanks.
Aurélien
- Mark as New
- Bookmark
- Subscribe
- Mute
- Subscribe to RSS Feed
- Permalink
- Report Inappropriate Content
For your information, actually I have this:
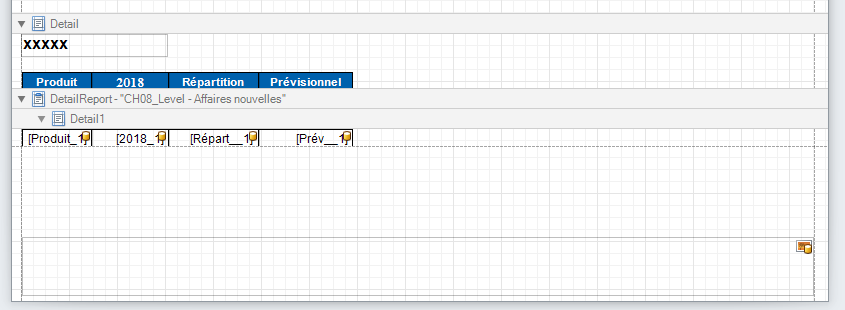
I don't know how insert my chart on the right.
Thank you very much.
- Mark as New
- Bookmark
- Subscribe
- Mute
- Subscribe to RSS Feed
- Permalink
- Report Inappropriate Content
First you have to add your chart object under the Image node of the NP Designer if you haven't already. Then from there you can simply click and drag it onto your canvas.
- Mark as New
- Bookmark
- Subscribe
- Mute
- Subscribe to RSS Feed
- Permalink
- Report Inappropriate Content
- « Previous Replies
-
- 1
- 2
- Next Replies »